

358
G. Chuiko et al.
the single finding of melatonin dosage [24–29, 31, 32]. Such inexpensive and fast
probing can give a chance to less wealthy clinics and patients.
The well-known Hill’s logistic curve is mostly in use for calibration graphs of a
dose–response kind [33, 34]. There are options with four or five parameters, but the
simpler one is more popular. We will revise here in the results [30] completed by
more recent data [28, 29]. We intend to trace the effect of the provenance of data on
the parameters of the calibration graph.
Calibers were samples of metabolite melatonin solutions in the urine. The definition of the concentration in samples has performed via two methods. The first
of them was enzyme-linked immunosorbent assays (ELISA) [24–29]. Another was
radio-immunoassay (RIA) that well-known as a highly accurate assay trial [31, 32].
The typical concentrations of melatonin metabolite in urine match the diapason
(0–420) ng/mL. The usual numbers of calibers in a set are up 6–8 [24–29, 31, 32].
One can find the description of Hill’s equation in [34]:
Y =
a + (b − a)
1 +
c
x
d
(1)
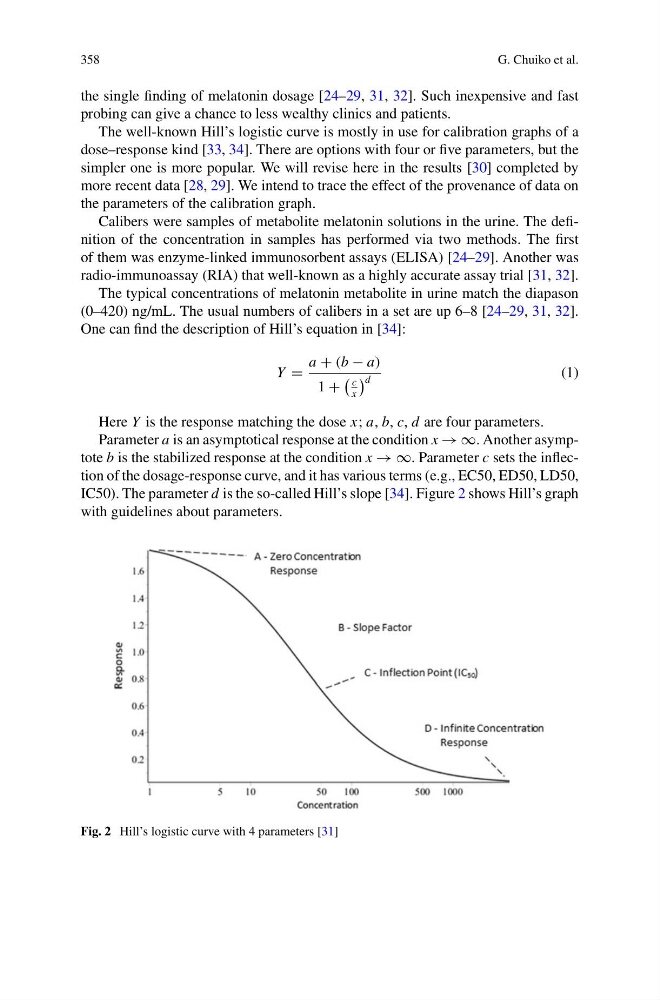
Here Y is the response matching the dose x; a, b, c, d are four parameters.
Parameter a is an asymptotical response at the condition x → ∞. Another asymptote b is the stabilized response at the condition x → ∞. Parameter c sets the inflection of the dosage-response curve, and it has various terms (e.g., EC50, ED50, LD50,
IC50). The parameter d is the so-called Hill’s slope [34]. Figure 2 shows Hill’s graph
with guidelines about parameters.
Fig. 2 Hill’s logistic curve with 4 parameters [31]
G. Chuiko et al.
the single finding of melatonin dosage [24–29, 31, 32]. Such inexpensive and fast
probing can give a chance to less wealthy clinics and patients.
The well-known Hill’s logistic curve is mostly in use for calibration graphs of a
dose–response kind [33, 34]. There are options with four or five parameters, but the
simpler one is more popular. We will revise here in the results [30] completed by
more recent data [28, 29]. We intend to trace the effect of the provenance of data on
the parameters of the calibration graph.
Calibers were samples of metabolite melatonin solutions in the urine. The definition of the concentration in samples has performed via two methods. The first
of them was enzyme-linked immunosorbent assays (ELISA) [24–29]. Another was
radio-immunoassay (RIA) that well-known as a highly accurate assay trial [31, 32].
The typical concentrations of melatonin metabolite in urine match the diapason
(0–420) ng/mL. The usual numbers of calibers in a set are up 6–8 [24–29, 31, 32].
One can find the description of Hill’s equation in [34]:
Y =
a + (b − a)
1 +
c
x
d
(1)
Here Y is the response matching the dose x; a, b, c, d are four parameters.
Parameter a is an asymptotical response at the condition x → ∞. Another asymptote b is the stabilized response at the condition x → ∞. Parameter c sets the inflection of the dosage-response curve, and it has various terms (e.g., EC50, ED50, LD50,
IC50). The parameter d is the so-called Hill’s slope [34]. Figure 2 shows Hill’s graph
with guidelines about parameters.
Fig. 2 Hill’s logistic curve with 4 parameters [31]