

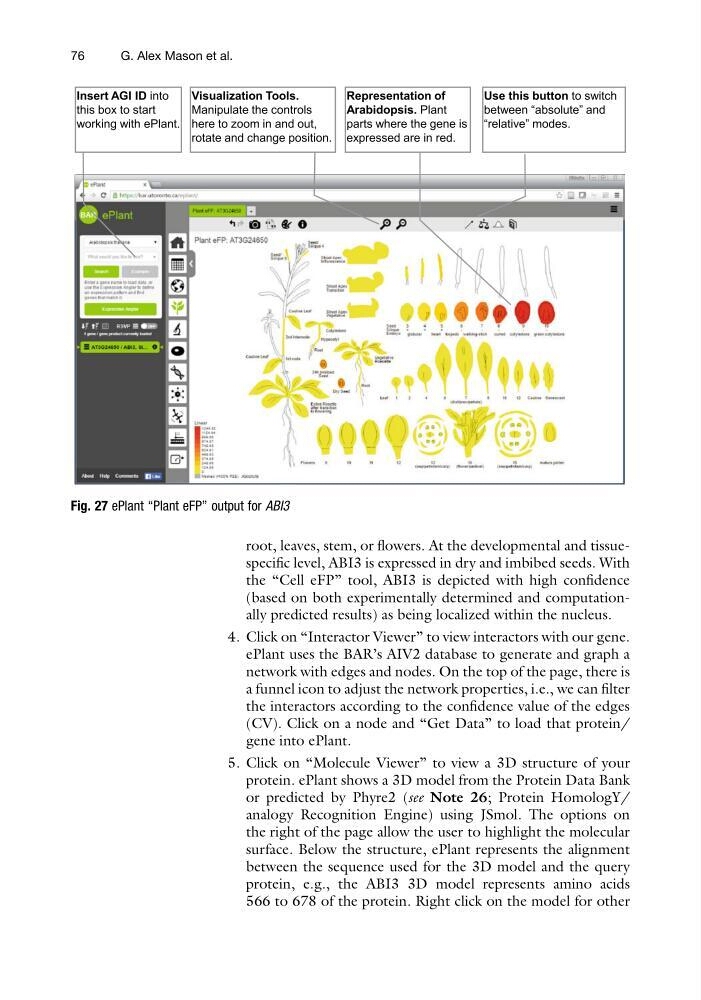
root, leaves, stem, or flowers. At the developmental and tissuespecific level, ABI3 is expressed in dry and imbibed seeds. With
the “Cell eFP” tool, ABI3 is depicted with high confidence
(based on both experimentally determined and computationally predicted results) as being localized within the nucleus.
4. Click on “Interactor Viewer” to view interactors with our gene.
ePlant uses the BAR’s AIV2 database to generate and graph a
network with edges and nodes. On the top of the page, there is
a funnel icon to adjust the network properties, i.e., we can filter
the interactors according to the confidence value of the edges
(CV). Click on a node and “Get Data” to load that protein/
gene into ePlant.
5. Click on “Molecule Viewer” to view a 3D structure of your
protein. ePlant shows a 3D model from the Protein Data Bank
or predicted by Phyre2 (see Note 26; Protein HomologY/
analogy Recognition Engine) using JSmol. The options on
the right of the page allow the user to highlight the molecular
surface. Below the structure, ePlant represents the alignment
between the sequence used for the 3D model and the query
protein, e.g., the ABI3 3D model represents amino acids
566 to 678 of the protein. Right click on the model for other
Fig. 27 ePlant “Plant eFP” output for ABI3
76
G. Alex Mason et al.
the “Cell eFP” tool, ABI3 is depicted with high confidence
(based on both experimentally determined and computationally predicted results) as being localized within the nucleus.
4. Click on “Interactor Viewer” to view interactors with our gene.
ePlant uses the BAR’s AIV2 database to generate and graph a
network with edges and nodes. On the top of the page, there is
a funnel icon to adjust the network properties, i.e., we can filter
the interactors according to the confidence value of the edges
(CV). Click on a node and “Get Data” to load that protein/
gene into ePlant.
5. Click on “Molecule Viewer” to view a 3D structure of your
protein. ePlant shows a 3D model from the Protein Data Bank
or predicted by Phyre2 (see Note 26; Protein HomologY/
analogy Recognition Engine) using JSmol. The options on
the right of the page allow the user to highlight the molecular
surface. Below the structure, ePlant represents the alignment
between the sequence used for the 3D model and the query
protein, e.g., the ABI3 3D model represents amino acids
566 to 678 of the protein. Right click on the model for other
Fig. 27 ePlant “Plant eFP” output for ABI3
76
G. Alex Mason et al.