

1. Go to http://bar.utoronto.ca/eplant.
2. Type the gene name or AGI ID of your gene of interest next
into the input box, at the top left of the page, e.g., At3g24650
for ABI3.
3. Click on “World eFP,” “Plant eFP,” or “Cell eFP” to explore
expression levels in the whole plant, in a specific tissue, or
developmental stage or to determine where the protein is
localized into the cell. For each analysis, ePlant uses SVG
graphics that represents the Arabidopsis plant, different plant
tissues, or a plant cell (see Fig. 27). Expression levels are represented from yellow (low) to red (high) in each drawing (see
Note 25). On the left part of each page, there are tools to
manipulate the visualization. The user can zoom in and zoom
out. On the “Plant expression” and “Tissue expression,” under
“sample list” buttons to change from “absolute” to “relative”
expression levels. Click on “Retrieve signal data” to get and/or
download the numerical gene expression information. ABI3 is
highly expressed on seed siliques, and it is not expressed in the
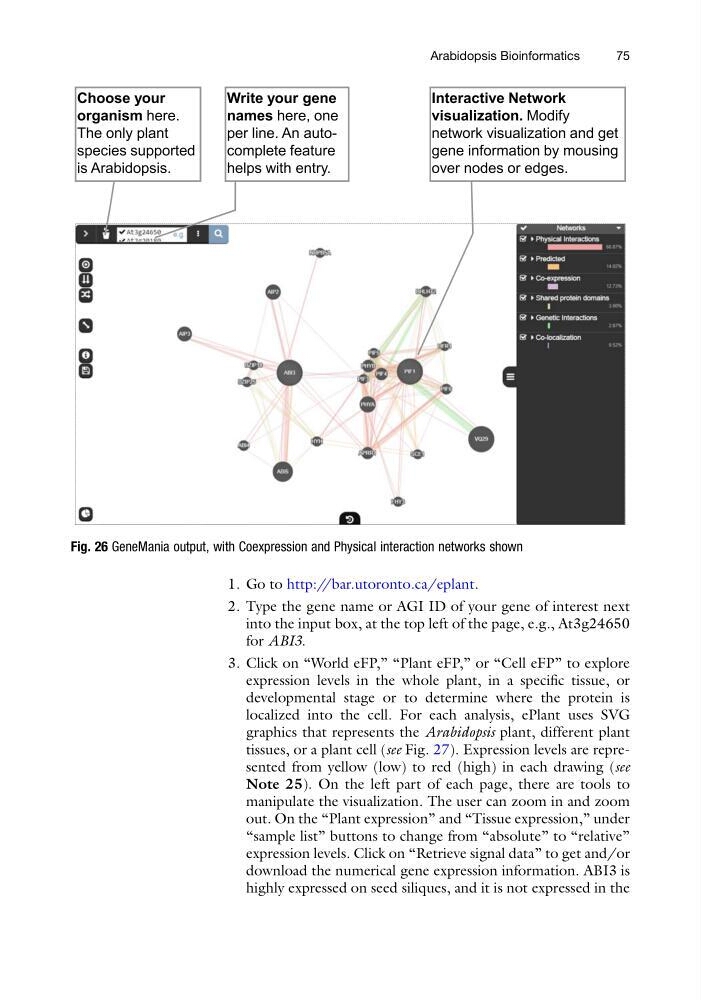
Fig. 26 GeneMania output, with Coexpression and Physical interaction networks shown
Arabidopsis Bioinformatics
75
2. Type the gene name or AGI ID of your gene of interest next
into the input box, at the top left of the page, e.g., At3g24650
for ABI3.
3. Click on “World eFP,” “Plant eFP,” or “Cell eFP” to explore
expression levels in the whole plant, in a specific tissue, or
developmental stage or to determine where the protein is
localized into the cell. For each analysis, ePlant uses SVG
graphics that represents the Arabidopsis plant, different plant
tissues, or a plant cell (see Fig. 27). Expression levels are represented from yellow (low) to red (high) in each drawing (see
Note 25). On the left part of each page, there are tools to
manipulate the visualization. The user can zoom in and zoom
out. On the “Plant expression” and “Tissue expression,” under
“sample list” buttons to change from “absolute” to “relative”
expression levels. Click on “Retrieve signal data” to get and/or
download the numerical gene expression information. ABI3 is
highly expressed on seed siliques, and it is not expressed in the
Fig. 26 GeneMania output, with Coexpression and Physical interaction networks shown
Arabidopsis Bioinformatics
75