

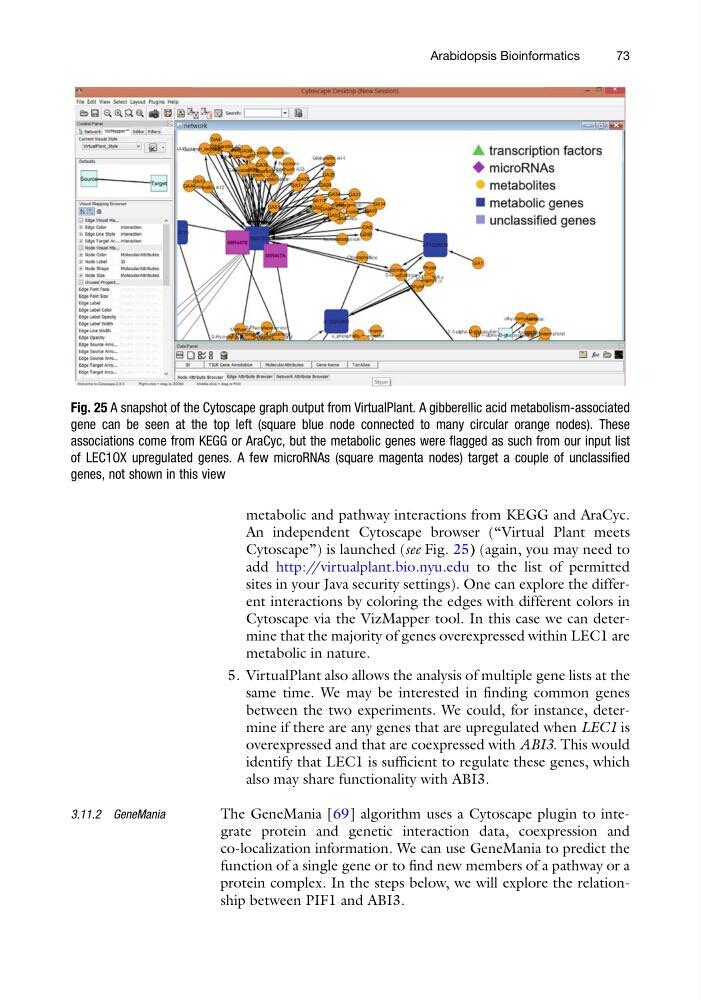
metabolic and pathway interactions from KEGG and AraCyc.
An independent Cytoscape browser (“Virtual Plant meets
Cytoscape”) is launched (see Fig. 25) (again, you may need to
add http://virtualplant.bio.nyu.edu to the list of permitted
sites in your Java security settings). One can explore the different interactions by coloring the edges with different colors in
Cytoscape via the VizMapper tool. In this case we can determine that the majority of genes overexpressed within LEC1 are
metabolic in nature.
5. VirtualPlant also allows the analysis of multiple gene lists at the
same time. We may be interested in finding common genes
between the two experiments. We could, for instance, determine if there are any genes that are upregulated when LEC1 is
overexpressed and that are coexpressed with ABI3. This would
identify that LEC1 is sufficient to regulate these genes, which
also may share functionality with ABI3.
3.11.2 GeneMania
The GeneMania [69] algorithm uses a Cytoscape plugin to integrate protein and genetic interaction data, coexpression and
co-localization information. We can use GeneMania to predict the
function of a single gene or to find new members of a pathway or a
protein complex. In the steps below, we will explore the relationship between PIF1 and ABI3.
Fig. 25 A snapshot of the Cytoscape graph output from VirtualPlant. A gibberellic acid metabolism-associated
gene can be seen at the top left (square blue node connected to many circular orange nodes). These
associations come from KEGG or AraCyc, but the metabolic genes were flagged as such from our input list
of LEC1OX upregulated genes. A few microRNAs (square magenta nodes) target a couple of unclassified
genes, not shown in this view
Arabidopsis Bioinformatics
73
An independent Cytoscape browser (“Virtual Plant meets
Cytoscape”) is launched (see Fig. 25) (again, you may need to
add http://virtualplant.bio.nyu.edu to the list of permitted
sites in your Java security settings). One can explore the different interactions by coloring the edges with different colors in
Cytoscape via the VizMapper tool. In this case we can determine that the majority of genes overexpressed within LEC1 are
metabolic in nature.
5. VirtualPlant also allows the analysis of multiple gene lists at the
same time. We may be interested in finding common genes
between the two experiments. We could, for instance, determine if there are any genes that are upregulated when LEC1 is
overexpressed and that are coexpressed with ABI3. This would
identify that LEC1 is sufficient to regulate these genes, which
also may share functionality with ABI3.
3.11.2 GeneMania
The GeneMania [69] algorithm uses a Cytoscape plugin to integrate protein and genetic interaction data, coexpression and
co-localization information. We can use GeneMania to predict the
function of a single gene or to find new members of a pathway or a
protein complex. In the steps below, we will explore the relationship between PIF1 and ABI3.
Fig. 25 A snapshot of the Cytoscape graph output from VirtualPlant. A gibberellic acid metabolism-associated
gene can be seen at the top left (square blue node connected to many circular orange nodes). These
associations come from KEGG or AraCyc, but the metabolic genes were flagged as such from our input list
of LEC1OX upregulated genes. A few microRNAs (square magenta nodes) target a couple of unclassified
genes, not shown in this view
Arabidopsis Bioinformatics
73