

6. On the left hand of the page you should see a summary of your
notebook along with notebooks created by other users that are
available for browsing. In addition to your own notebook, you
should also display “Features: all” and “SNPs” by clicking on
these links. “Features: all” contains typical genomic features of
A. thaliana including but not limited to: genes, transposons,
small RNA loci, pseudogenes, etc. [5]. “SNPs” displays data
from the 1001 Genomes project that describes polymorphic
loci across A. thaliana ecotypes [11].
7. Next, visualize the locus containing ABI3. At the top of the
genome browser, enter the following coordinates:
“3:8991671..9001200.” You should now be looking at ABI3
and its upstream region.
8. You may also be interested in viewing your own data in this
instance of JBrowse. To do this, click “Track” at the top of the
browser and select “Open track file or URL.” From here select
the file to upload, in this case we’ve provided an example data
set: “unionDNaseHypersensitiveSites.gff3” (see Note 3)
[22]. Click “Open.”
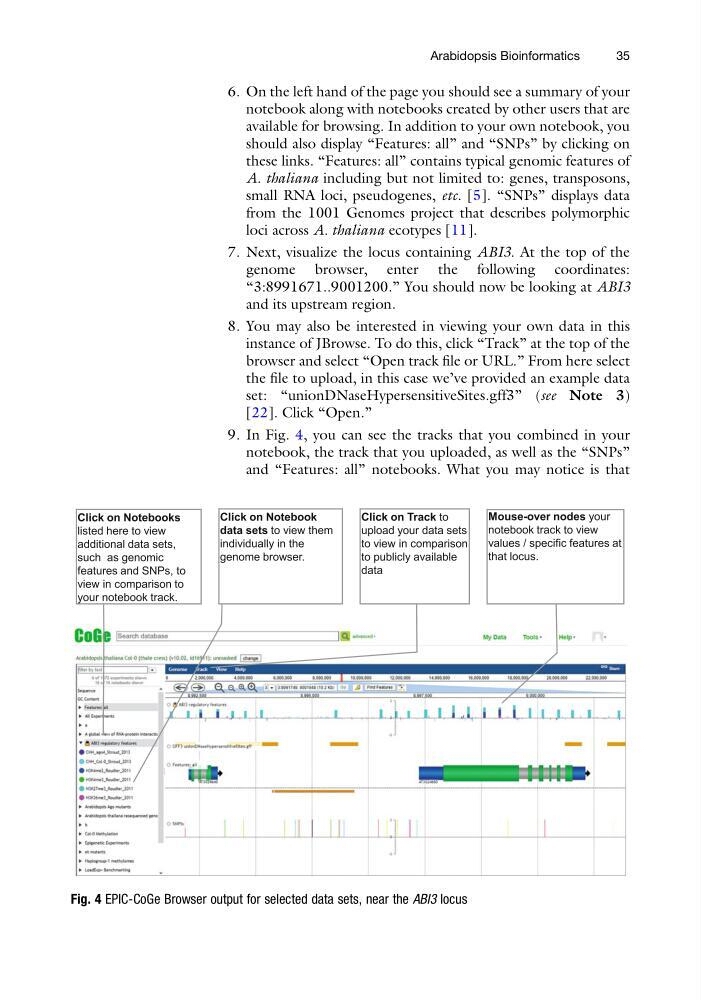
9. In Fig. 4, you can see the tracks that you combined in your
notebook, the track that you uploaded, as well as the “SNPs”
and “Features: all” notebooks. What you may notice is that
Fig. 4 EPIC-CoGe Browser output for selected data sets, near the ABI3 locus
Arabidopsis Bioinformatics
35
notebook along with notebooks created by other users that are
available for browsing. In addition to your own notebook, you
should also display “Features: all” and “SNPs” by clicking on
these links. “Features: all” contains typical genomic features of
A. thaliana including but not limited to: genes, transposons,
small RNA loci, pseudogenes, etc. [5]. “SNPs” displays data
from the 1001 Genomes project that describes polymorphic
loci across A. thaliana ecotypes [11].
7. Next, visualize the locus containing ABI3. At the top of the
genome browser, enter the following coordinates:
“3:8991671..9001200.” You should now be looking at ABI3
and its upstream region.
8. You may also be interested in viewing your own data in this
instance of JBrowse. To do this, click “Track” at the top of the
browser and select “Open track file or URL.” From here select
the file to upload, in this case we’ve provided an example data
set: “unionDNaseHypersensitiveSites.gff3” (see Note 3)
[22]. Click “Open.”
9. In Fig. 4, you can see the tracks that you combined in your
notebook, the track that you uploaded, as well as the “SNPs”
and “Features: all” notebooks. What you may notice is that
Fig. 4 EPIC-CoGe Browser output for selected data sets, near the ABI3 locus
Arabidopsis Bioinformatics
35