

3.6.2 Make Graph
1. Measure the average intensities (mean value) of the green
channel and the orange channel and of the ratio images
(green/orange) (ROI Manager > More > Multi Measure).
2. Adjust measured values to the relative measure (time 0 ¼ 1).
Time 0 is the starting time for perfusion of control solution
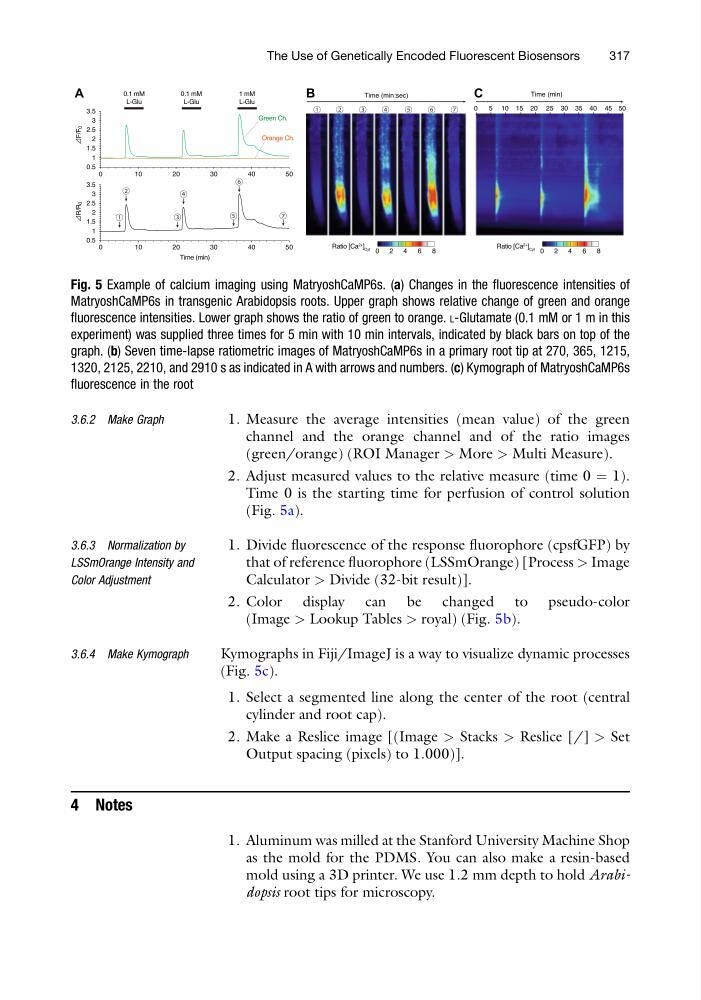
(Fig. 5a).
3.6.3 Normalization by
LSSmOrange Intensity and
Color Adjustment
1. Divide fluorescence of the response fluorophore (cpsfGFP) by
that of reference fluorophore (LSSmOrange) [Process > Image
Calculator > Divide (32-bit result)].
2. Color display can be changed to pseudo-color
(Image > Lookup Tables > royal) (Fig. 5b).
3.6.4 Make Kymograph
Kymographs in Fiji/ImageJ is a way to visualize dynamic processes
(Fig. 5c).
1. Select a segmented line along the center of the root (central
cylinder and root cap).
2. Make a Reslice image [(Image > Stacks > Reslice [/] > Set
Output spacing (pixels) to 1.000)].
4 Notes
1. Aluminum was milled at the Stanford University Machine Shop
as the mold for the PDMS. You can also make a resin-based
mold using a 3D printer. We use 1.2 mm depth to hold Arabidopsis root tips for microscopy.
0.5
1
1.5
2
2.5
3
3.5
0
1 0
2 0
3 0
4 0
5 0
0
1 0
2 0
3 0
4 0
5 0
0.5
1
1.5
2
2.5
3
3.5
0.1 mM
L-Glu
0.1 mM
L-Glu
1 mM
L-Glu
F/F0
R/R0
Ratio [Ca 2+ ] Cyt
Time (min)
0
5 10 15 20 25 30 35 40 45 50
Time (min:sec)
Time (min)
8
0
2
4
6
A
C
B
Green Ch.
Orange Ch.
Ratio [Ca 2+ ] Cyt
8
0
2
4
6
Fig. 5 Example of calcium imaging using MatryoshCaMP6s. (a) Changes in the fluorescence intensities of
MatryoshCaMP6s in transgenic Arabidopsis roots. Upper graph shows relative change of green and orange
fluorescence intensities. Lower graph shows the ratio of green to orange. L-Glutamate (0.1 mM or 1 m in this
experiment) was supplied three times for 5 min with 10 min intervals, indicated by black bars on top of the
graph. (b) Seven time-lapse ratiometric images of MatryoshCaMP6s in a primary root tip at 270, 365, 1215,
1320, 2125, 2210, and 2910 s as indicated in A with arrows and numbers. (c) Kymograph of MatryoshCaMP6s
fluorescence in the root
The Use of Genetically Encoded Fluorescent Biosensors
317
1. Measure the average intensities (mean value) of the green
channel and the orange channel and of the ratio images
(green/orange) (ROI Manager > More > Multi Measure).
2. Adjust measured values to the relative measure (time 0 ¼ 1).
Time 0 is the starting time for perfusion of control solution
(Fig. 5a).
3.6.3 Normalization by
LSSmOrange Intensity and
Color Adjustment
1. Divide fluorescence of the response fluorophore (cpsfGFP) by
that of reference fluorophore (LSSmOrange) [Process > Image
Calculator > Divide (32-bit result)].
2. Color display can be changed to pseudo-color
(Image > Lookup Tables > royal) (Fig. 5b).
3.6.4 Make Kymograph
Kymographs in Fiji/ImageJ is a way to visualize dynamic processes
(Fig. 5c).
1. Select a segmented line along the center of the root (central
cylinder and root cap).
2. Make a Reslice image [(Image > Stacks > Reslice [/] > Set
Output spacing (pixels) to 1.000)].
4 Notes
1. Aluminum was milled at the Stanford University Machine Shop
as the mold for the PDMS. You can also make a resin-based
mold using a 3D printer. We use 1.2 mm depth to hold Arabidopsis root tips for microscopy.
0.5
1
1.5
2
2.5
3
3.5
0
1 0
2 0
3 0
4 0
5 0
0
1 0
2 0
3 0
4 0
5 0
0.5
1
1.5
2
2.5
3
3.5
0.1 mM
L-Glu
0.1 mM
L-Glu
1 mM
L-Glu
F/F0
R/R0
Ratio [Ca 2+ ] Cyt
Time (min)
0
5 10 15 20 25 30 35 40 45 50
Time (min:sec)
Time (min)
8
0
2
4
6
A
C
B
Green Ch.
Orange Ch.
Ratio [Ca 2+ ] Cyt
8
0
2
4
6
Fig. 5 Example of calcium imaging using MatryoshCaMP6s. (a) Changes in the fluorescence intensities of
MatryoshCaMP6s in transgenic Arabidopsis roots. Upper graph shows relative change of green and orange
fluorescence intensities. Lower graph shows the ratio of green to orange. L-Glutamate (0.1 mM or 1 m in this
experiment) was supplied three times for 5 min with 10 min intervals, indicated by black bars on top of the
graph. (b) Seven time-lapse ratiometric images of MatryoshCaMP6s in a primary root tip at 270, 365, 1215,
1320, 2125, 2210, and 2910 s as indicated in A with arrows and numbers. (c) Kymograph of MatryoshCaMP6s
fluorescence in the root
The Use of Genetically Encoded Fluorescent Biosensors
317