

37 participants from Ghana who had no known accidental or occupational exposure
to dioxins/furans but exhibited levels of ~5.3 pg WHO-TEQ/g. However, the data
retraining to the levels of dioxins and furans are limited in environmental matrices.
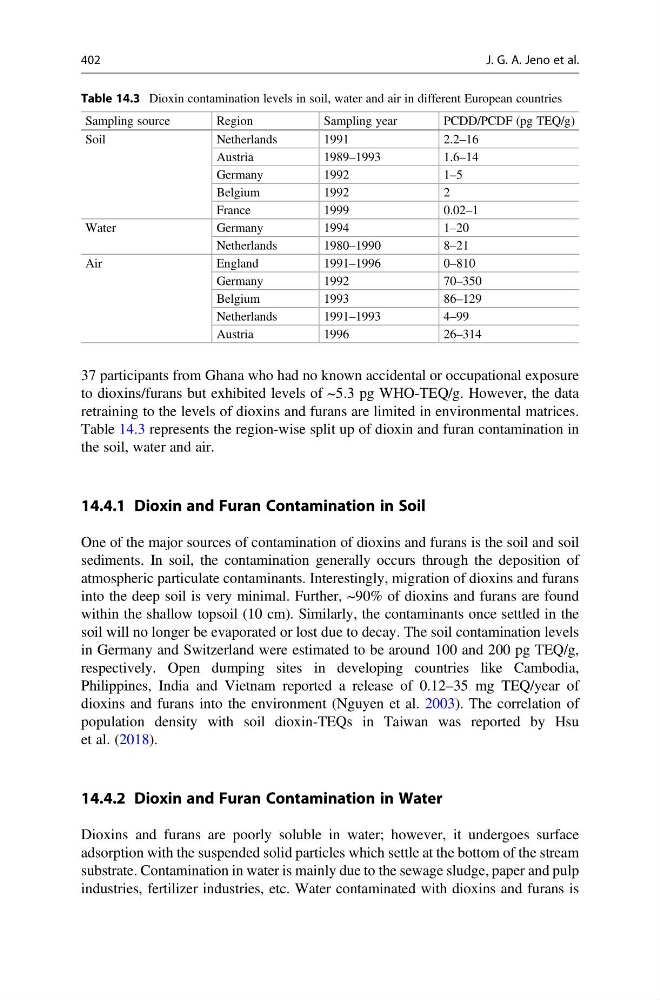
Table 14.3 represents the region-wise split up of dioxin and furan contamination in
the soil, water and air.
14.4.1 Dioxin and Furan Contamination in Soil
One of the major sources of contamination of dioxins and furans is the soil and soil
sediments. In soil, the contamination generally occurs through the deposition of
atmospheric particulate contaminants. Interestingly, migration of dioxins and furans
into the deep soil is very minimal. Further, ~90% of dioxins and furans are found
within the shallow topsoil (10 cm). Similarly, the contaminants once settled in the
soil will no longer be evaporated or lost due to decay. The soil contamination levels
in Germany and Switzerland were estimated to be around 100 and 200 pg TEQ/g,
respectively. Open dumping sites in developing countries like Cambodia,
Philippines, India and Vietnam reported a release of 0.12–35 mg TEQ/year of
dioxins and furans into the environment (Nguyen et al. 2003). The correlation of
population density with soil dioxin-TEQs in Taiwan was reported by Hsu
et al. (2018).
14.4.2 Dioxin and Furan Contamination in Water
Dioxins and furans are poorly soluble in water; however, it undergoes surface
adsorption with the suspended solid particles which settle at the bottom of the stream
substrate. Contamination in water is mainly due to the sewage sludge, paper and pulp
industries, fertilizer industries, etc. Water contaminated with dioxins and furans is
Table 14.3 Dioxin contamination levels in soil, water and air in different European countries
Sampling source
Region
Sampling year
PCDD/PCDF (pg TEQ/g)
Soil
Netherlands
1991
2.2–16
Austria
1989–1993
1.6–14
Germany
1992
1–5
Belgium
1992
2
France
1999
0.02–1
Water
Germany
1994
1–20
Netherlands
1980–1990
8–21
Air
England
1991–1996
0–810
Germany
1992
70–350
Belgium
1993
86–129
Netherlands
1991–1993
4–99
Austria
1996
26–314
402
J. G. A. Jeno et al.
to dioxins/furans but exhibited levels of ~5.3 pg WHO-TEQ/g. However, the data
retraining to the levels of dioxins and furans are limited in environmental matrices.
Table 14.3 represents the region-wise split up of dioxin and furan contamination in
the soil, water and air.
14.4.1 Dioxin and Furan Contamination in Soil
One of the major sources of contamination of dioxins and furans is the soil and soil
sediments. In soil, the contamination generally occurs through the deposition of
atmospheric particulate contaminants. Interestingly, migration of dioxins and furans
into the deep soil is very minimal. Further, ~90% of dioxins and furans are found
within the shallow topsoil (10 cm). Similarly, the contaminants once settled in the
soil will no longer be evaporated or lost due to decay. The soil contamination levels
in Germany and Switzerland were estimated to be around 100 and 200 pg TEQ/g,
respectively. Open dumping sites in developing countries like Cambodia,
Philippines, India and Vietnam reported a release of 0.12–35 mg TEQ/year of
dioxins and furans into the environment (Nguyen et al. 2003). The correlation of
population density with soil dioxin-TEQs in Taiwan was reported by Hsu
et al. (2018).
14.4.2 Dioxin and Furan Contamination in Water
Dioxins and furans are poorly soluble in water; however, it undergoes surface
adsorption with the suspended solid particles which settle at the bottom of the stream
substrate. Contamination in water is mainly due to the sewage sludge, paper and pulp
industries, fertilizer industries, etc. Water contaminated with dioxins and furans is
Table 14.3 Dioxin contamination levels in soil, water and air in different European countries
Sampling source
Region
Sampling year
PCDD/PCDF (pg TEQ/g)
Soil
Netherlands
1991
2.2–16
Austria
1989–1993
1.6–14
Germany
1992
1–5
Belgium
1992
2
France
1999
0.02–1
Water
Germany
1994
1–20
Netherlands
1980–1990
8–21
Air
England
1991–1996
0–810
Germany
1992
70–350
Belgium
1993
86–129
Netherlands
1991–1993
4–99
Austria
1996
26–314
402
J. G. A. Jeno et al.