

14.3.3 Industrial
Processes in the chemical industry, pulp and paper industry, dry cleaning,
brominated flame-retardants manufacturing, metallurgical processes, reactivation
processes of granular carbon, etc. are some examples of industrial sources of dioxins
and furans. These toxic chemicals are generated as a by-product during the manufacture of chlorinated pesticides, phenoxy herbicides and polyvinyl chloride synthesis. In pulp and paper industries, chemical bleaching of pulp with chlorine produced
PCDDs/PCDFs
and
its
congeners
like
2,3,7,8-TCDD,
2,3,7,8tetrachlorodibenzofuran (2,3,7,8-TCDF) and 1,2,7,8-tetrachlorodibenzofuran
(1,2,7,8-TCDF). Wang et al. (2012) reported the average annual emission of concentration PCDDs/PCDFs from Chinese non-wood pulp and paper mills to be
27.59 g I-TEQ. Further, 2,3,7,8-TCDF highly formed during hypochlorite bleaching
stage and removed during alkaline digestion, extraction and hydrogen peroxide
bleaching. The recycling process of TV plastic materials resulted in the release of
a higher amount (ten-fold increase) of dioxins/furans when compared with the
original material (Ortuño et al. 2015).
In India, the major dioxin congener from pulp and paper mills was 1,3,6,8-TCDD
found before effluent treatment, while 2,5-diphenyl furan congener was found in the
secondary sludge of effluent treatment plant. Metallurgy industry is the major
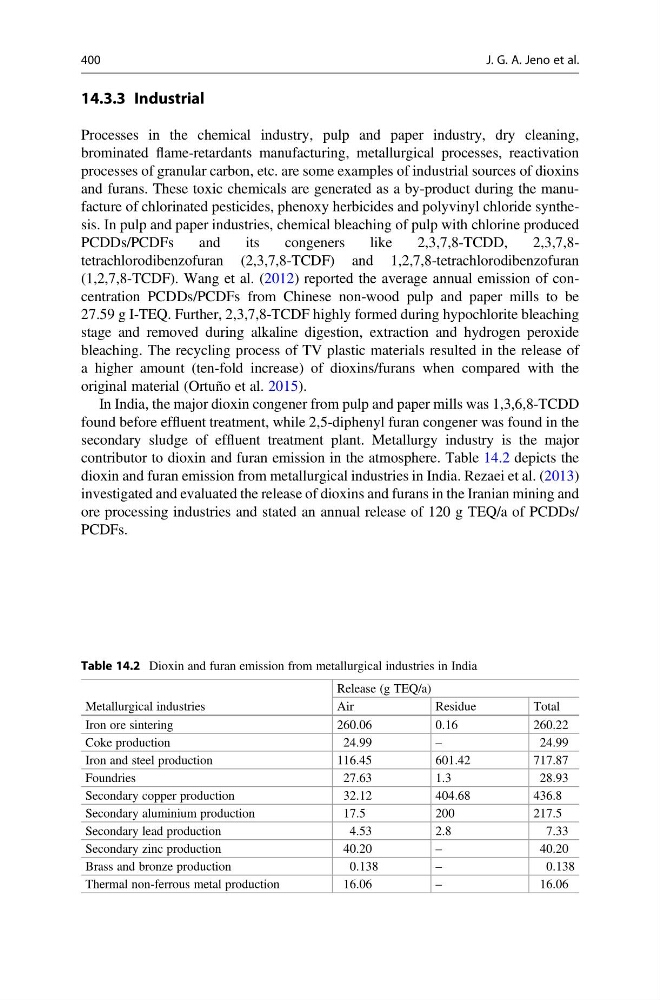
contributor to dioxin and furan emission in the atmosphere. Table 14.2 depicts the
dioxin and furan emission from metallurgical industries in India. Rezaei et al. (2013)
investigated and evaluated the release of dioxins and furans in the Iranian mining and
ore processing industries and stated an annual release of 120 g TEQ/a of PCDDs/
PCDFs.
Table 14.2 Dioxin and furan emission from metallurgical industries in India
Metallurgical industries
Release (g TEQ/a)
Air
Residue
Total
Iron ore sintering
260.06
0.16
260.22
Coke production
24.99
–
24.99
Iron and steel production
116.45
601.42
717.87
Foundries
27.63
1.3
28.93
Secondary copper production
32.12
404.68
436.8
Secondary aluminium production
17.5
200
217.5
Secondary lead production
4.53
2.8
7.33
Secondary zinc production
40.20
–
40.20
Brass and bronze production
0.138
–
0.138
Thermal non-ferrous metal production
16.06
–
16.06
400
J. G. A. Jeno et al.
Processes in the chemical industry, pulp and paper industry, dry cleaning,
brominated flame-retardants manufacturing, metallurgical processes, reactivation
processes of granular carbon, etc. are some examples of industrial sources of dioxins
and furans. These toxic chemicals are generated as a by-product during the manufacture of chlorinated pesticides, phenoxy herbicides and polyvinyl chloride synthesis. In pulp and paper industries, chemical bleaching of pulp with chlorine produced
PCDDs/PCDFs
and
its
congeners
like
2,3,7,8-TCDD,
2,3,7,8tetrachlorodibenzofuran (2,3,7,8-TCDF) and 1,2,7,8-tetrachlorodibenzofuran
(1,2,7,8-TCDF). Wang et al. (2012) reported the average annual emission of concentration PCDDs/PCDFs from Chinese non-wood pulp and paper mills to be
27.59 g I-TEQ. Further, 2,3,7,8-TCDF highly formed during hypochlorite bleaching
stage and removed during alkaline digestion, extraction and hydrogen peroxide
bleaching. The recycling process of TV plastic materials resulted in the release of
a higher amount (ten-fold increase) of dioxins/furans when compared with the
original material (Ortuño et al. 2015).
In India, the major dioxin congener from pulp and paper mills was 1,3,6,8-TCDD
found before effluent treatment, while 2,5-diphenyl furan congener was found in the
secondary sludge of effluent treatment plant. Metallurgy industry is the major
contributor to dioxin and furan emission in the atmosphere. Table 14.2 depicts the
dioxin and furan emission from metallurgical industries in India. Rezaei et al. (2013)
investigated and evaluated the release of dioxins and furans in the Iranian mining and
ore processing industries and stated an annual release of 120 g TEQ/a of PCDDs/
PCDFs.
Table 14.2 Dioxin and furan emission from metallurgical industries in India
Metallurgical industries
Release (g TEQ/a)
Air
Residue
Total
Iron ore sintering
260.06
0.16
260.22
Coke production
24.99
–
24.99
Iron and steel production
116.45
601.42
717.87
Foundries
27.63
1.3
28.93
Secondary copper production
32.12
404.68
436.8
Secondary aluminium production
17.5
200
217.5
Secondary lead production
4.53
2.8
7.33
Secondary zinc production
40.20
–
40.20
Brass and bronze production
0.138
–
0.138
Thermal non-ferrous metal production
16.06
–
16.06
400
J. G. A. Jeno et al.