

excellent waste disposal sytems in place. Many low- to middle-income countries in
South Asia and sub-Saharan Africa are facing 80–90% of the plastic pollution with
underdeveloped waste management system, resulting in high incidence of river and
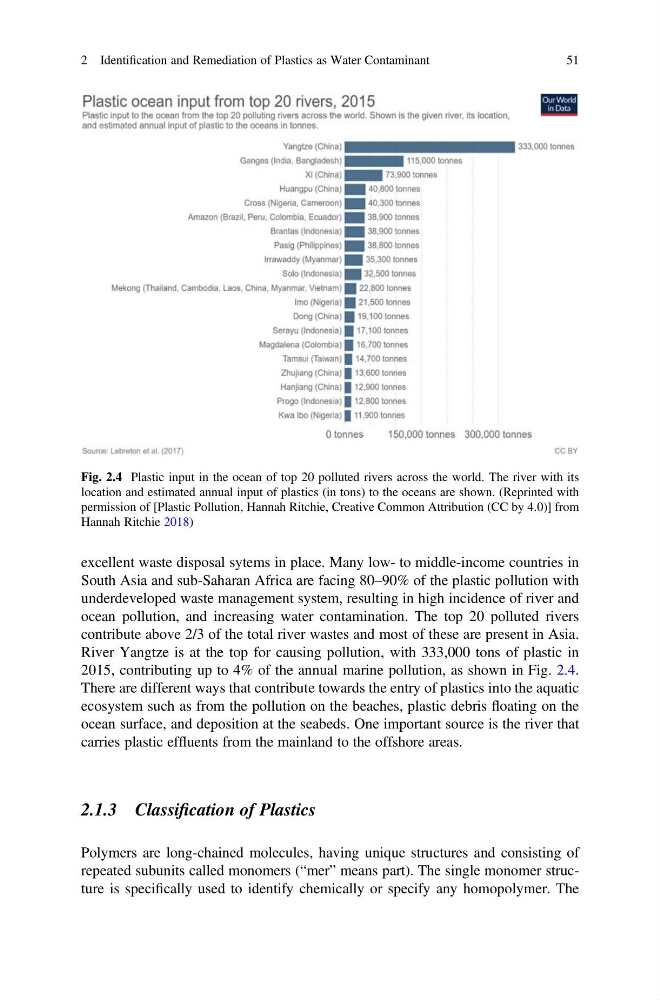
ocean pollution, and increasing water contamination. The top 20 polluted rivers
contribute above 2/3 of the total river wastes and most of these are present in Asia.
River Yangtze is at the top for causing pollution, with 333,000 tons of plastic in
2015, contributing up to 4% of the annual marine pollution, as shown in Fig. 2.4.
There are different ways that contribute towards the entry of plastics into the aquatic
ecosystem such as from the pollution on the beaches, plastic debris floating on the
ocean surface, and deposition at the seabeds. One important source is the river that
carries plastic effluents from the mainland to the offshore areas.
2.1.3 Classification of Plastics
Polymers are long-chained molecules, having unique structures and consisting of
repeated subunits called monomers (“mer” means part). The single monomer structure is specifically used to identify chemically or specify any homopolymer. The
Fig. 2.4 Plastic input in the ocean of top 20 polluted rivers across the world. The river with its
location and estimated annual input of plastics (in tons) to the oceans are shown. (Reprinted with
permission of [Plastic Pollution, Hannah Ritchie, Creative Common Attribution (CC by 4.0)] from
Hannah Ritchie 2018)
2 Identification and Remediation of Plastics as Water Contaminant
51
South Asia and sub-Saharan Africa are facing 80–90% of the plastic pollution with
underdeveloped waste management system, resulting in high incidence of river and
ocean pollution, and increasing water contamination. The top 20 polluted rivers
contribute above 2/3 of the total river wastes and most of these are present in Asia.
River Yangtze is at the top for causing pollution, with 333,000 tons of plastic in
2015, contributing up to 4% of the annual marine pollution, as shown in Fig. 2.4.
There are different ways that contribute towards the entry of plastics into the aquatic
ecosystem such as from the pollution on the beaches, plastic debris floating on the
ocean surface, and deposition at the seabeds. One important source is the river that
carries plastic effluents from the mainland to the offshore areas.
2.1.3 Classification of Plastics
Polymers are long-chained molecules, having unique structures and consisting of
repeated subunits called monomers (“mer” means part). The single monomer structure is specifically used to identify chemically or specify any homopolymer. The
Fig. 2.4 Plastic input in the ocean of top 20 polluted rivers across the world. The river with its
location and estimated annual input of plastics (in tons) to the oceans are shown. (Reprinted with
permission of [Plastic Pollution, Hannah Ritchie, Creative Common Attribution (CC by 4.0)] from
Hannah Ritchie 2018)
2 Identification and Remediation of Plastics as Water Contaminant
51