

items per km
2 . Another study conducted in the northwestern Pacific (Pan et al. 2019)
recorded about 10,000 items per km
2 , a very lower concentration than that obtained
in Japanese seas. Compared to Mediterranean data, seas in Asia are much more
contaminated.
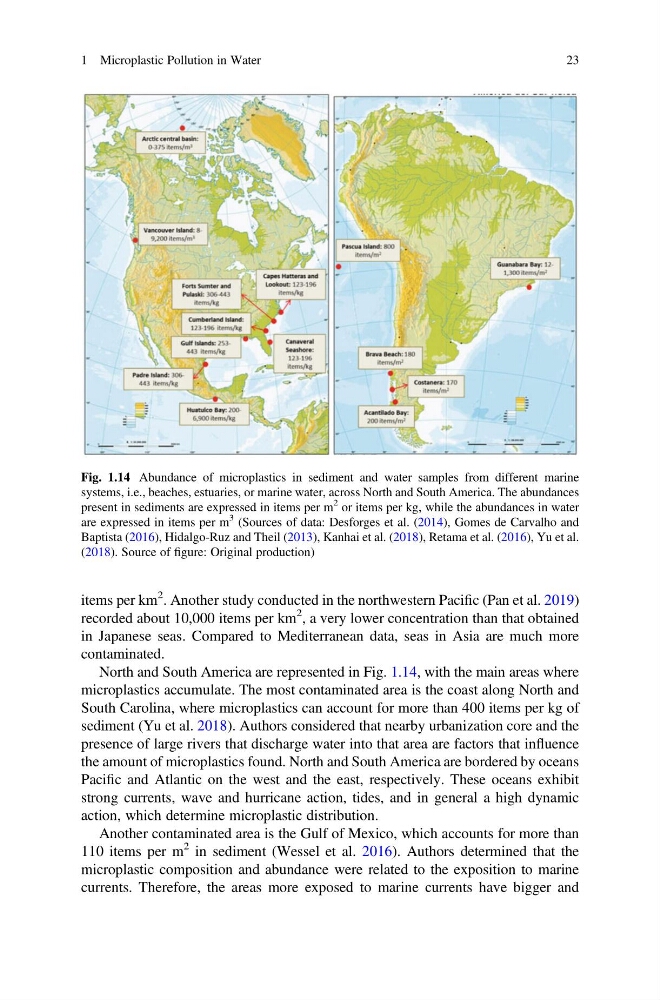
North and South America are represented in Fig. 1.14, with the main areas where
microplastics accumulate. The most contaminated area is the coast along North and
South Carolina, where microplastics can account for more than 400 items per kg of
sediment (Yu et al. 2018). Authors considered that nearby urbanization core and the
presence of large rivers that discharge water into that area are factors that influence
the amount of microplastics found. North and South America are bordered by oceans
Pacific and Atlantic on the west and the east, respectively. These oceans exhibit
strong currents, wave and hurricane action, tides, and in general a high dynamic
action, which determine microplastic distribution.
Another contaminated area is the Gulf of Mexico, which accounts for more than
110 items per m
2 in sediment (Wessel et al. 2016). Authors determined that the
microplastic composition and abundance were related to the exposition to marine
currents. Therefore, the areas more exposed to marine currents have bigger and
Fig. 1.14 Abundance of microplastics in sediment and water samples from different marine
systems, i.e., beaches, estuaries, or marine water, across North and South America. The abundances
present in sediments are expressed in items per m
2 or items per kg, while the abundances in water
are expressed in items per m
3 (Sources of data: Desforges et al. (2014), Gomes de Carvalho and
Baptista (2016), Hidalgo-Ruz and Theil (2013), Kanhai et al. (2018), Retama et al. (2016), Yu et al.
(2018). Source of figure: Original production)
1 Microplastic Pollution in Water
23
2 . Another study conducted in the northwestern Pacific (Pan et al. 2019)
recorded about 10,000 items per km
2 , a very lower concentration than that obtained
in Japanese seas. Compared to Mediterranean data, seas in Asia are much more
contaminated.
North and South America are represented in Fig. 1.14, with the main areas where
microplastics accumulate. The most contaminated area is the coast along North and
South Carolina, where microplastics can account for more than 400 items per kg of
sediment (Yu et al. 2018). Authors considered that nearby urbanization core and the
presence of large rivers that discharge water into that area are factors that influence
the amount of microplastics found. North and South America are bordered by oceans
Pacific and Atlantic on the west and the east, respectively. These oceans exhibit
strong currents, wave and hurricane action, tides, and in general a high dynamic
action, which determine microplastic distribution.
Another contaminated area is the Gulf of Mexico, which accounts for more than
110 items per m
2 in sediment (Wessel et al. 2016). Authors determined that the
microplastic composition and abundance were related to the exposition to marine
currents. Therefore, the areas more exposed to marine currents have bigger and
Fig. 1.14 Abundance of microplastics in sediment and water samples from different marine
systems, i.e., beaches, estuaries, or marine water, across North and South America. The abundances
present in sediments are expressed in items per m
2 or items per kg, while the abundances in water
are expressed in items per m
3 (Sources of data: Desforges et al. (2014), Gomes de Carvalho and
Baptista (2016), Hidalgo-Ruz and Theil (2013), Kanhai et al. (2018), Retama et al. (2016), Yu et al.
(2018). Source of figure: Original production)
1 Microplastic Pollution in Water
23