

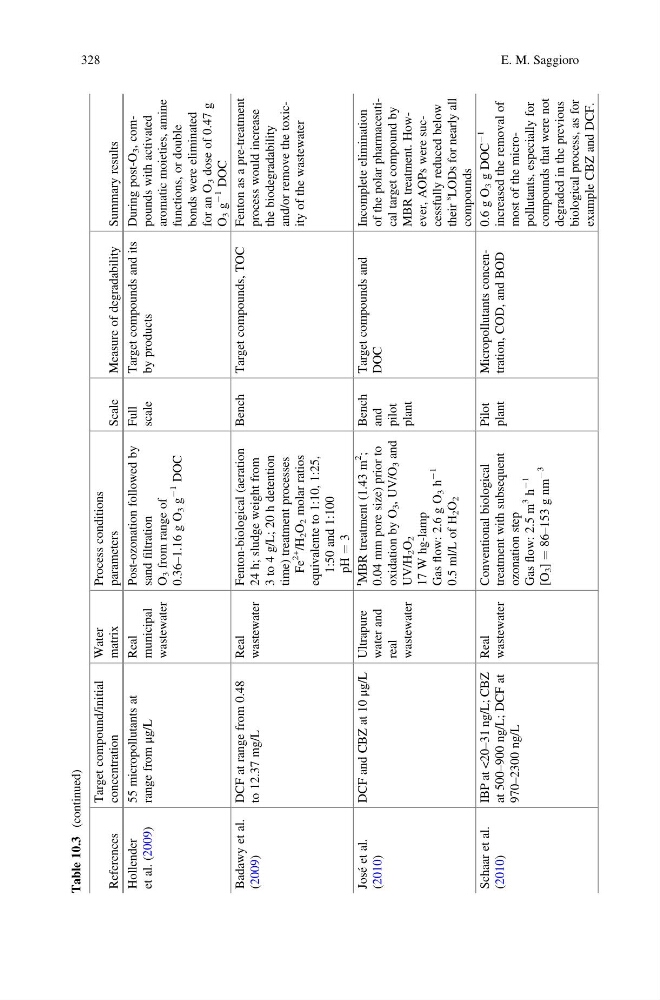
Table 10.3
(continued)
References
Target compound/initial
concentration
Water
matrix
Process conditions
parameters
Scale
Measure of degradability
Summary results
Hollender
et al. (2009)
55 micropollutants at
range from
μg/L
Real
municipal
wastewater
Post-ozonation followed by
sand
filtration
O
3 from range of
0.36–1.16 g O
3 g
À1
DOC
Full
scale
Target compounds and its
by products
During post-O
3 , compounds with activated
aromatic moieties, amine
functions, or double
bonds were eliminated
for an O
3 dose of 0.47 g
O
3 g
À1
DOC
Badawy et al.
(2009)
DCF at range from 0.48
to 12.37 mg/L
Real
wastewater
Fenton-biological (aeration
24 h; sludge weight from
3 to 4 g/L; 20 h detention
time) treatment processes
Fe
2+
/H
2 O
2 molar ratios
equivalente to 1:10, 1:25,
1:50 and 1:100
pH
¼ 3
Bench
Target compounds, TOC
Fenton as a pre-treatment
process would increase
the biodegradability
and/or remove the toxicity of the wastewater
José et al.
(2010)
DCF and CBZ at 10
μg/L Ultrapure
water and
real
wastewater
r
MBR treatment (1.43 m
2
;
0.04 mm pore size) prior to
oxidation by O
3 , UV/O
3 and
UV/H
2 O
2
17 W hg-lamp
Gas
flow: 2.6 g O
3 h
À1
0.5 ml/L of H
2 O
2
Bench
and
pilot
plant
Target compounds and
DOC
Incomplete elimination
of the polar pharmaceutical target compound by
MBR treatment. However, AOPs were successfully reduced below
their
s
LODs for nearly all
compounds
Schaar et al.
(2010)
IBP at <20–31 ng/L; CBZ
at 500–900 ng/L; DCF at
970–2300 ng/L
Real
wastewater
Conventional biological
treatment with subsequent
ozonation step
Gas
flow: 2.5 m
3
h
À1
[O
3 ]
¼ 86–153 g nm
À3
Pilot
plant
Micropollutants concentration, COD, and BOD
0.6 g O
3 g DOC
À1
increased the removal of
most of the micropollutants, especially for
compounds that were not
degraded in the previous
biological process, as for
example CBZ and DCF.
328
E. M. Saggioro
(continued)
References
Target compound/initial
concentration
Water
matrix
Process conditions
parameters
Scale
Measure of degradability
Summary results
Hollender
et al. (2009)
55 micropollutants at
range from
μg/L
Real
municipal
wastewater
Post-ozonation followed by
sand
filtration
O
3 from range of
0.36–1.16 g O
3 g
À1
DOC
Full
scale
Target compounds and its
by products
During post-O
3 , compounds with activated
aromatic moieties, amine
functions, or double
bonds were eliminated
for an O
3 dose of 0.47 g
O
3 g
À1
DOC
Badawy et al.
(2009)
DCF at range from 0.48
to 12.37 mg/L
Real
wastewater
Fenton-biological (aeration
24 h; sludge weight from
3 to 4 g/L; 20 h detention
time) treatment processes
Fe
2+
/H
2 O
2 molar ratios
equivalente to 1:10, 1:25,
1:50 and 1:100
pH
¼ 3
Bench
Target compounds, TOC
Fenton as a pre-treatment
process would increase
the biodegradability
and/or remove the toxicity of the wastewater
José et al.
(2010)
DCF and CBZ at 10
μg/L Ultrapure
water and
real
wastewater
r
MBR treatment (1.43 m
2
;
0.04 mm pore size) prior to
oxidation by O
3 , UV/O
3 and
UV/H
2 O
2
17 W hg-lamp
Gas
flow: 2.6 g O
3 h
À1
0.5 ml/L of H
2 O
2
Bench
and
pilot
plant
Target compounds and
DOC
Incomplete elimination
of the polar pharmaceutical target compound by
MBR treatment. However, AOPs were successfully reduced below
their
s
LODs for nearly all
compounds
Schaar et al.
(2010)
IBP at <20–31 ng/L; CBZ
at 500–900 ng/L; DCF at
970–2300 ng/L
Real
wastewater
Conventional biological
treatment with subsequent
ozonation step
Gas
flow: 2.5 m
3
h
À1
[O
3 ]
¼ 86–153 g nm
À3
Pilot
plant
Micropollutants concentration, COD, and BOD
0.6 g O
3 g DOC
À1
increased the removal of
most of the micropollutants, especially for
compounds that were not
degraded in the previous
biological process, as for
example CBZ and DCF.
328
E. M. Saggioro