

from 78–330, 1.9–5.6, and 92–481 μg kg
À1 , respectively. The bioaccumulation
range of sulfadoxine, sulfachloropyridazine, chloramphenicol, and sulfamethoxazole in radish leaves was found between 0.2–0.6, 0.1–0.5, 8–30, and 0.9–2.7 μg kg
À1 ,
respectively. In addition, concentrations ranged from 1.7–3.6, 1.1, and 5–20 μg kg
À1 in celery leaves for ofloxacin, pefloxacin, and lincomycin, respectively.
Quinolones were also predominantly occurred in aquatic plants and aquatic animals
with the corresponding concentrations ranged from 8.37–6532 μg kg
À1 and 17.8–167 μg kg
À1 , respectively. Similarly, macrolides were also detected at a
non-detectable level of 182 μg kg
À1 in China (Li et al. 2013). Contaminants from
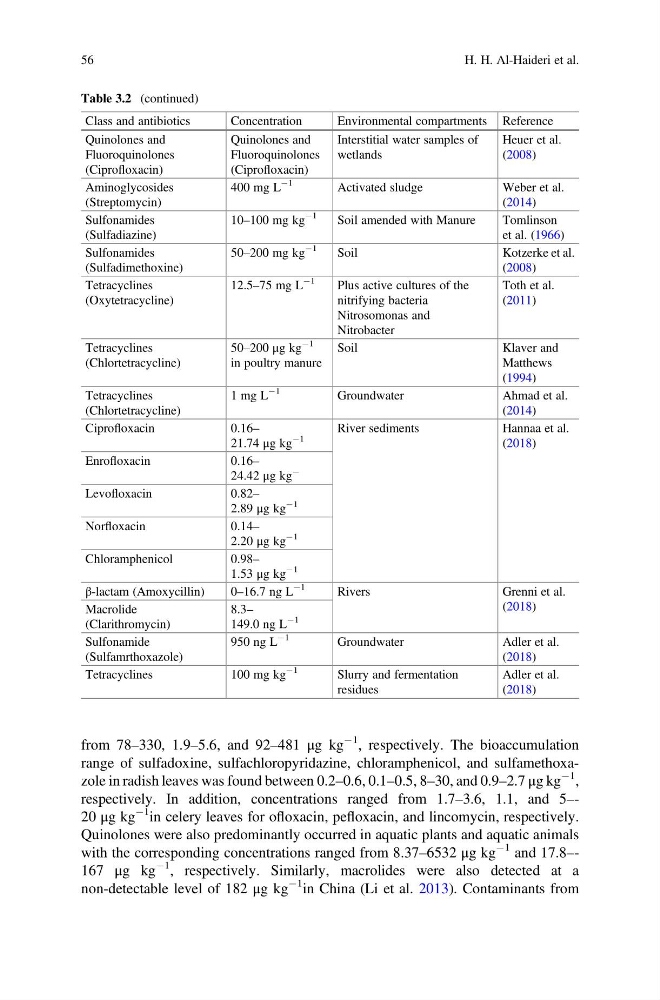
Table 3.2 (continued)
Class and antibiotics
Concentration
Environmental compartments Reference
Quinolones and
Fluoroquinolones
(Ciprofloxacin)
Quinolones and
Fluoroquinolones
(Ciprofloxacin)
Interstitial water samples of
wetlands
Heuer et al.
(2008)
Aminoglycosides
(Streptomycin)
400 mg L
À1
Activated sludge
Weber et al.
(2014)
Sulfonamides
(Sulfadiazine)
10–100 mg kg
À1
Soil amended with Manure
Tomlinson
et al. (1966)
Sulfonamides
(Sulfadimethoxine)
50–200 mg kg
À1
Soil
Kotzerke et al.
(2008)
Tetracyclines
(Oxytetracycline)
12.5–75 mg L
À1
Plus active cultures of the
nitrifying bacteria
Nitrosomonas and
Nitrobacter
Toth et al.
(2011)
Tetracyclines
(Chlortetracycline)
50–200 μg kg
À1
in poultry manure
Soil
Klaver and
Matthews
(1994)
Tetracyclines
(Chlortetracycline)
1 mg L
À1
Groundwater
Ahmad et al.
(2014)
Ciprofloxacin
0.16–
21.74 μg kg
À1
River sediments
Hannaa et al.
(2018)
Enrofloxacin
0.16–
24.42 μg kg
À
Levofloxacin
0.82–
2.89 μg kg
À1
Norfloxacin
0.14–
2.20 μg kg
À1
Chloramphenicol
0.98–
1.53 μg kg
À1
β-lactam (Amoxycillin)
0–16.7 ng L
À1
Rivers
Grenni et al.
(2018)
Macrolide
(Clarithromycin)
8.3–
149.0 ng L
À1
Sulfonamide
(Sulfamrthoxazole)
950 ng L
À1
Groundwater
Adler et al.
(2018)
Tetracyclines
100 mg kg
À1
Slurry and fermentation
residues
Adler et al.
(2018)
56
H. H. Al-Haideri et al.
À1 , respectively. The bioaccumulation
range of sulfadoxine, sulfachloropyridazine, chloramphenicol, and sulfamethoxazole in radish leaves was found between 0.2–0.6, 0.1–0.5, 8–30, and 0.9–2.7 μg kg
À1 ,
respectively. In addition, concentrations ranged from 1.7–3.6, 1.1, and 5–20 μg kg
À1 in celery leaves for ofloxacin, pefloxacin, and lincomycin, respectively.
Quinolones were also predominantly occurred in aquatic plants and aquatic animals
with the corresponding concentrations ranged from 8.37–6532 μg kg
À1 and 17.8–167 μg kg
À1 , respectively. Similarly, macrolides were also detected at a
non-detectable level of 182 μg kg
À1 in China (Li et al. 2013). Contaminants from
Table 3.2 (continued)
Class and antibiotics
Concentration
Environmental compartments Reference
Quinolones and
Fluoroquinolones
(Ciprofloxacin)
Quinolones and
Fluoroquinolones
(Ciprofloxacin)
Interstitial water samples of
wetlands
Heuer et al.
(2008)
Aminoglycosides
(Streptomycin)
400 mg L
À1
Activated sludge
Weber et al.
(2014)
Sulfonamides
(Sulfadiazine)
10–100 mg kg
À1
Soil amended with Manure
Tomlinson
et al. (1966)
Sulfonamides
(Sulfadimethoxine)
50–200 mg kg
À1
Soil
Kotzerke et al.
(2008)
Tetracyclines
(Oxytetracycline)
12.5–75 mg L
À1
Plus active cultures of the
nitrifying bacteria
Nitrosomonas and
Nitrobacter
Toth et al.
(2011)
Tetracyclines
(Chlortetracycline)
50–200 μg kg
À1
in poultry manure
Soil
Klaver and
Matthews
(1994)
Tetracyclines
(Chlortetracycline)
1 mg L
À1
Groundwater
Ahmad et al.
(2014)
Ciprofloxacin
0.16–
21.74 μg kg
À1
River sediments
Hannaa et al.
(2018)
Enrofloxacin
0.16–
24.42 μg kg
À
Levofloxacin
0.82–
2.89 μg kg
À1
Norfloxacin
0.14–
2.20 μg kg
À1
Chloramphenicol
0.98–
1.53 μg kg
À1
β-lactam (Amoxycillin)
0–16.7 ng L
À1
Rivers
Grenni et al.
(2018)
Macrolide
(Clarithromycin)
8.3–
149.0 ng L
À1
Sulfonamide
(Sulfamrthoxazole)
950 ng L
À1
Groundwater
Adler et al.
(2018)
Tetracyclines
100 mg kg
À1
Slurry and fermentation
residues
Adler et al.
(2018)
56
H. H. Al-Haideri et al.