

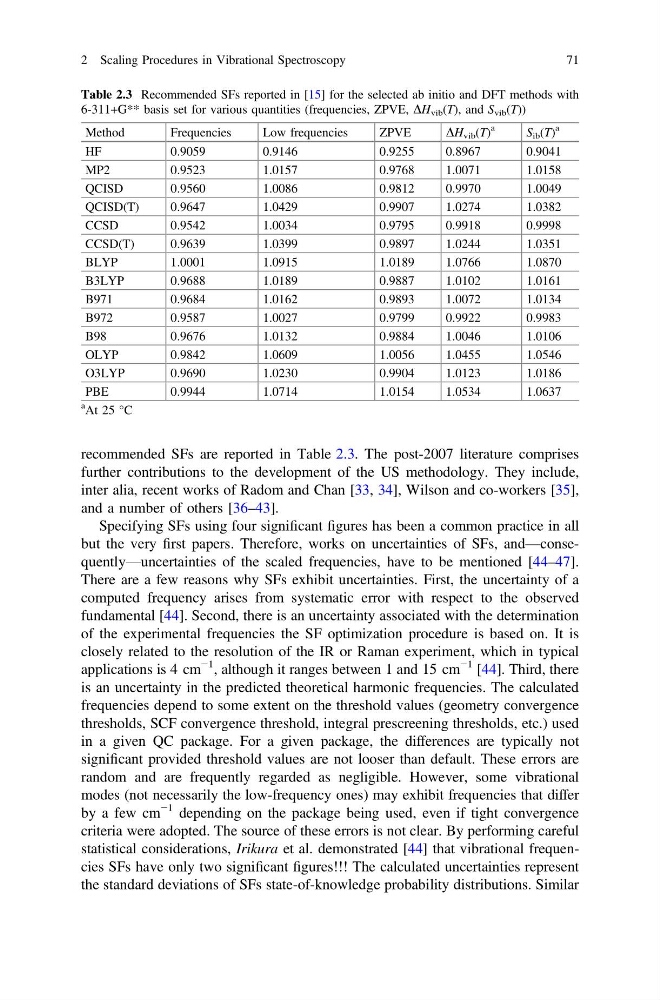
recommended SFs are reported in Table 2.3. The post-2007 literature comprises
further contributions to the development of the US methodology. They include,
inter alia, recent works of Radom and Chan [33, 34], Wilson and co-workers [35],
and a number of others [36–43].
Specifying SFs using four significant figures has been a common practice in all
but the very first papers. Therefore, works on uncertainties of SFs, and—consequently—uncertainties of the scaled frequencies, have to be mentioned [44–47].
There are a few reasons why SFs exhibit uncertainties. First, the uncertainty of a
computed frequency arises from systematic error with respect to the observed
fundamental [44]. Second, there is an uncertainty associated with the determination
of the experimental frequencies the SF optimization procedure is based on. It is
closely related to the resolution of the IR or Raman experiment, which in typical
applications is 4 cm
−1 , although it ranges between 1 and 15 cm
−1 [44]. Third, there
is an uncertainty in the predicted theoretical harmonic frequencies. The calculated
frequencies depend to some extent on the threshold values (geometry convergence
thresholds, SCF convergence threshold, integral prescreening thresholds, etc.) used
in a given QC package. For a given package, the differences are typically not
significant provided threshold values are not looser than default. These errors are
random and are frequently regarded as negligible. However, some vibrational
modes (not necessarily the low-frequency ones) may exhibit frequencies that differ
by a few cm
−1 depending on the package being used, even if tight convergence
criteria were adopted. The source of these errors is not clear. By performing careful
statistical considerations, Irikura et al. demonstrated [44] that vibrational frequencies SFs have only two significant figures!!! The calculated uncertainties represent
the standard deviations of SFs state-of-knowledge probability distributions. Similar
Table 2.3 Recommended SFs reported in [15] for the selected ab initio and DFT methods with
6-311+G** basis set for various quantities (frequencies, ZPVE, DH vib (T), and S vib (T))
Method
Frequencies
Low frequencies
ZPVE
DH vib (T)
a
S ib (T)
a
HF
0.9059
0.9146
0.9255
0.8967
0.9041
MP2
0.9523
1.0157
0.9768
1.0071
1.0158
QCISD
0.9560
1.0086
0.9812
0.9970
1.0049
QCISD(T)
0.9647
1.0429
0.9907
1.0274
1.0382
CCSD
0.9542
1.0034
0.9795
0.9918
0.9998
CCSD(T)
0.9639
1.0399
0.9897
1.0244
1.0351
BLYP
1.0001
1.0915
1.0189
1.0766
1.0870
B3LYP
0.9688
1.0189
0.9887
1.0102
1.0161
B971
0.9684
1.0162
0.9893
1.0072
1.0134
B972
0.9587
1.0027
0.9799
0.9922
0.9983
B98
0.9676
1.0132
0.9884
1.0046
1.0106
OLYP
0.9842
1.0609
1.0056
1.0455
1.0546
O3LYP
0.9690
1.0230
0.9904
1.0123
1.0186
PBE
0.9944
1.0714
1.0154
1.0534
1.0637
a At 25 °C
2 Scaling Procedures in Vibrational Spectroscopy
71
further contributions to the development of the US methodology. They include,
inter alia, recent works of Radom and Chan [33, 34], Wilson and co-workers [35],
and a number of others [36–43].
Specifying SFs using four significant figures has been a common practice in all
but the very first papers. Therefore, works on uncertainties of SFs, and—consequently—uncertainties of the scaled frequencies, have to be mentioned [44–47].
There are a few reasons why SFs exhibit uncertainties. First, the uncertainty of a
computed frequency arises from systematic error with respect to the observed
fundamental [44]. Second, there is an uncertainty associated with the determination
of the experimental frequencies the SF optimization procedure is based on. It is
closely related to the resolution of the IR or Raman experiment, which in typical
applications is 4 cm
−1 , although it ranges between 1 and 15 cm
−1 [44]. Third, there
is an uncertainty in the predicted theoretical harmonic frequencies. The calculated
frequencies depend to some extent on the threshold values (geometry convergence
thresholds, SCF convergence threshold, integral prescreening thresholds, etc.) used
in a given QC package. For a given package, the differences are typically not
significant provided threshold values are not looser than default. These errors are
random and are frequently regarded as negligible. However, some vibrational
modes (not necessarily the low-frequency ones) may exhibit frequencies that differ
by a few cm
−1 depending on the package being used, even if tight convergence
criteria were adopted. The source of these errors is not clear. By performing careful
statistical considerations, Irikura et al. demonstrated [44] that vibrational frequencies SFs have only two significant figures!!! The calculated uncertainties represent
the standard deviations of SFs state-of-knowledge probability distributions. Similar
Table 2.3 Recommended SFs reported in [15] for the selected ab initio and DFT methods with
6-311+G** basis set for various quantities (frequencies, ZPVE, DH vib (T), and S vib (T))
Method
Frequencies
Low frequencies
ZPVE
DH vib (T)
a
S ib (T)
a
HF
0.9059
0.9146
0.9255
0.8967
0.9041
MP2
0.9523
1.0157
0.9768
1.0071
1.0158
QCISD
0.9560
1.0086
0.9812
0.9970
1.0049
QCISD(T)
0.9647
1.0429
0.9907
1.0274
1.0382
CCSD
0.9542
1.0034
0.9795
0.9918
0.9998
CCSD(T)
0.9639
1.0399
0.9897
1.0244
1.0351
BLYP
1.0001
1.0915
1.0189
1.0766
1.0870
B3LYP
0.9688
1.0189
0.9887
1.0102
1.0161
B971
0.9684
1.0162
0.9893
1.0072
1.0134
B972
0.9587
1.0027
0.9799
0.9922
0.9983
B98
0.9676
1.0132
0.9884
1.0046
1.0106
OLYP
0.9842
1.0609
1.0056
1.0455
1.0546
O3LYP
0.9690
1.0230
0.9904
1.0123
1.0186
PBE
0.9944
1.0714
1.0154
1.0534
1.0637
a At 25 °C
2 Scaling Procedures in Vibrational Spectroscopy
71