

MFT measurements are based on FORS and carry more information than just
DE* ab , and information on the direction of color changes (e.g., yellowing, darkening, fading), but the spectra interpretation leading to chemical identification of
components is not usually carried out by MFT practitioners. Some authors though
express the tested light resistance of faded samples by other measures than color
changes. Liang [157] and Bacci [158] proposed to use spectral change in the
absorption region (DR) as an alternative way to quantify light sensitivity of an
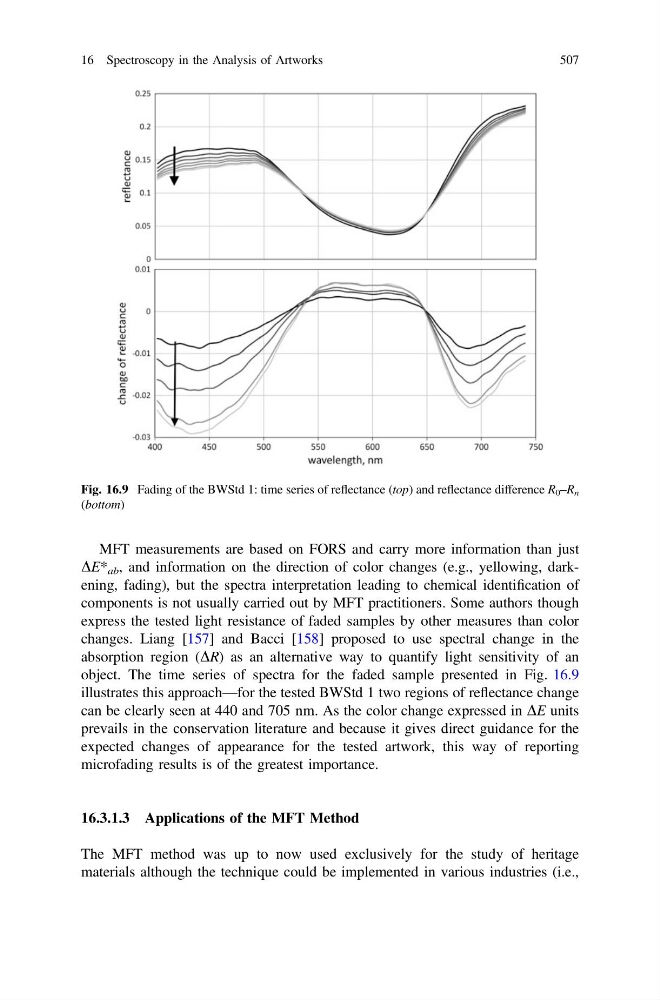
object. The time series of spectra for the faded sample presented in Fig. 16.9
illustrates this approach—for the tested BWStd 1 two regions of reflectance change
can be clearly seen at 440 and 705 nm. As the color change expressed in DE units
prevails in the conservation literature and because it gives direct guidance for the
expected changes of appearance for the tested artwork, this way of reporting
microfading results is of the greatest importance.
16.3.1.3 Applications of the MFT Method
The MFT method was up to now used exclusively for the study of heritage
materials although the technique could be implemented in various industries (i.e.,
Fig. 16.9 Fading of the BWStd 1: time series of reflectance (top) and reflectance difference R 0 –R n
(bottom)
16 Spectroscopy in the Analysis of Artworks
507
DE* ab , and information on the direction of color changes (e.g., yellowing, darkening, fading), but the spectra interpretation leading to chemical identification of
components is not usually carried out by MFT practitioners. Some authors though
express the tested light resistance of faded samples by other measures than color
changes. Liang [157] and Bacci [158] proposed to use spectral change in the
absorption region (DR) as an alternative way to quantify light sensitivity of an
object. The time series of spectra for the faded sample presented in Fig. 16.9
illustrates this approach—for the tested BWStd 1 two regions of reflectance change
can be clearly seen at 440 and 705 nm. As the color change expressed in DE units
prevails in the conservation literature and because it gives direct guidance for the
expected changes of appearance for the tested artwork, this way of reporting
microfading results is of the greatest importance.
16.3.1.3 Applications of the MFT Method
The MFT method was up to now used exclusively for the study of heritage
materials although the technique could be implemented in various industries (i.e.,
Fig. 16.9 Fading of the BWStd 1: time series of reflectance (top) and reflectance difference R 0 –R n
(bottom)
16 Spectroscopy in the Analysis of Artworks
507