

bridges; however, in the case of calsilite glass, there are only Si–O–Al bridges. In
leucite and potassium feldspar, both connections are formed simultaneously, which
is why two maxima are observed in their spectra. The correctness of attributing
bonds in this region to bridge vibrations is indicated by the change in the ratio of
their intensities along with aluminum concentration increase, i.e., as the number of
Si–O–Al bridges increased.
When discussing the spectra of aluminosilicate glasses, it should be remembered
that the influence of aluminum ions, present in material in an octahedral coordination, on these spectra is relatively difficult to determine. Tarte [60] suggests that
band characteristic for [AlO 6 ] should appear in the range of 530–400 cm
−1 in the
case of isolated octahedrons and in the range of 680–500 cm
−1 for connected ones.
However, these are regions where bands associated with ring vibrations are present.
Thus, on the basis of IR spectra measurements, it cannot be unambiguously
determined to what degree such aluminum coordination exists in the glass structure
or if it is present at all. Of course, its presence cannot be ruled out.
Another operation that facilitates interpretation of spectra with complex envelopes is the possibility of creating their arithmetic sum or difference. Summation
should be performed on spectra comprising an identical absorbance scale, after first
aligning them. This alignment consists of correcting the baseline and using the
appropriate weights for added spectra, proportional to the percentage share of
individual components. Of course, the spectrum obtained as a result of summation
cannot be considered as a kind of averaged spectrum, inter alia, due to different
integral radiation absorption coefficients of vibrations in the initial spectra.
However, after verifying the result with an experimentally obtained spectrum, the
structural heterogeneity of multi-component glasses can be confirmed on the basis
of that operation.
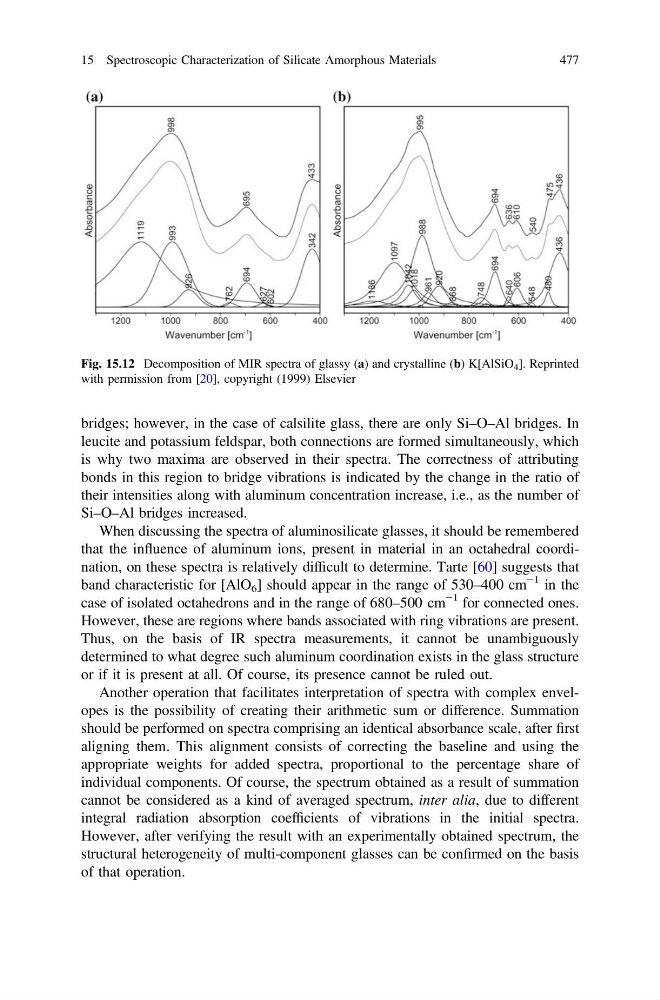
Fig. 15.12 Decomposition of MIR spectra of glassy (a) and crystalline (b) K[AlSiO 4 ]. Reprinted
with permission from [20], copyright (1999) Elsevier
15 Spectroscopic Characterization of Silicate Amorphous Materials
477
leucite and potassium feldspar, both connections are formed simultaneously, which
is why two maxima are observed in their spectra. The correctness of attributing
bonds in this region to bridge vibrations is indicated by the change in the ratio of
their intensities along with aluminum concentration increase, i.e., as the number of
Si–O–Al bridges increased.
When discussing the spectra of aluminosilicate glasses, it should be remembered
that the influence of aluminum ions, present in material in an octahedral coordination, on these spectra is relatively difficult to determine. Tarte [60] suggests that
band characteristic for [AlO 6 ] should appear in the range of 530–400 cm
−1 in the
case of isolated octahedrons and in the range of 680–500 cm
−1 for connected ones.
However, these are regions where bands associated with ring vibrations are present.
Thus, on the basis of IR spectra measurements, it cannot be unambiguously
determined to what degree such aluminum coordination exists in the glass structure
or if it is present at all. Of course, its presence cannot be ruled out.
Another operation that facilitates interpretation of spectra with complex envelopes is the possibility of creating their arithmetic sum or difference. Summation
should be performed on spectra comprising an identical absorbance scale, after first
aligning them. This alignment consists of correcting the baseline and using the
appropriate weights for added spectra, proportional to the percentage share of
individual components. Of course, the spectrum obtained as a result of summation
cannot be considered as a kind of averaged spectrum, inter alia, due to different
integral radiation absorption coefficients of vibrations in the initial spectra.
However, after verifying the result with an experimentally obtained spectrum, the
structural heterogeneity of multi-component glasses can be confirmed on the basis
of that operation.
Fig. 15.12 Decomposition of MIR spectra of glassy (a) and crystalline (b) K[AlSiO 4 ]. Reprinted
with permission from [20], copyright (1999) Elsevier
15 Spectroscopic Characterization of Silicate Amorphous Materials
477