

N ¼
m 1 À m 2
ð
Þ
Rc i
ð15:1Þ
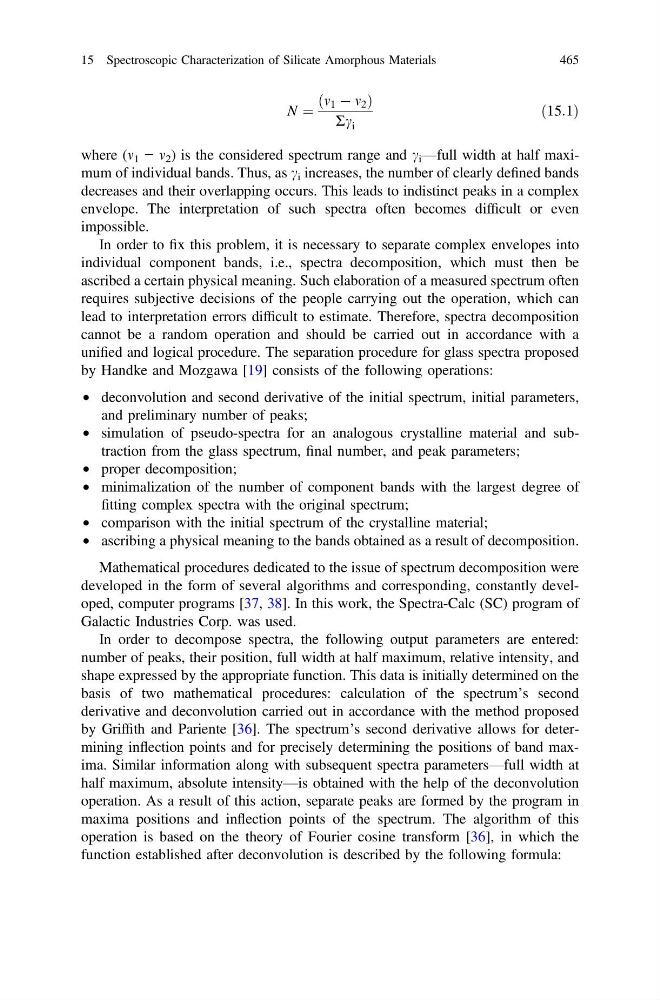
where (m 1 − m 2 ) is the considered spectrum range and c i —full width at half maximum of individual bands. Thus, as c i increases, the number of clearly defined bands
decreases and their overlapping occurs. This leads to indistinct peaks in a complex
envelope. The interpretation of such spectra often becomes difficult or even
impossible.
In order to fix this problem, it is necessary to separate complex envelopes into
individual component bands, i.e., spectra decomposition, which must then be
ascribed a certain physical meaning. Such elaboration of a measured spectrum often
requires subjective decisions of the people carrying out the operation, which can
lead to interpretation errors difficult to estimate. Therefore, spectra decomposition
cannot be a random operation and should be carried out in accordance with a
unified and logical procedure. The separation procedure for glass spectra proposed
by Handke and Mozgawa [19] consists of the following operations:
• deconvolution and second derivative of the initial spectrum, initial parameters,
and preliminary number of peaks;
• simulation of pseudo-spectra for an analogous crystalline material and subtraction from the glass spectrum, final number, and peak parameters;
• proper decomposition;
• minimalization of the number of component bands with the largest degree of
fitting complex spectra with the original spectrum;
• comparison with the initial spectrum of the crystalline material;
• ascribing a physical meaning to the bands obtained as a result of decomposition.
Mathematical procedures dedicated to the issue of spectrum decomposition were
developed in the form of several algorithms and corresponding, constantly developed, computer programs [37, 38]. In this work, the Spectra-Calc (SC) program of
Galactic Industries Corp. was used.
In order to decompose spectra, the following output parameters are entered:
number of peaks, their position, full width at half maximum, relative intensity, and
shape expressed by the appropriate function. This data is initially determined on the
basis of two mathematical procedures: calculation of the spectrum’s second
derivative and deconvolution carried out in accordance with the method proposed
by Griffith and Pariente [36]. The spectrum’s second derivative allows for determining inflection points and for precisely determining the positions of band maxima. Similar information along with subsequent spectra parameters—full width at
half maximum, absolute intensity—is obtained with the help of the deconvolution
operation. As a result of this action, separate peaks are formed by the program in
maxima positions and inflection points of the spectrum. The algorithm of this
operation is based on the theory of Fourier cosine transform [36], in which the
function established after deconvolution is described by the following formula:
15 Spectroscopic Characterization of Silicate Amorphous Materials
465
m 1 À m 2
ð
Þ
Rc i
ð15:1Þ
where (m 1 − m 2 ) is the considered spectrum range and c i —full width at half maximum of individual bands. Thus, as c i increases, the number of clearly defined bands
decreases and their overlapping occurs. This leads to indistinct peaks in a complex
envelope. The interpretation of such spectra often becomes difficult or even
impossible.
In order to fix this problem, it is necessary to separate complex envelopes into
individual component bands, i.e., spectra decomposition, which must then be
ascribed a certain physical meaning. Such elaboration of a measured spectrum often
requires subjective decisions of the people carrying out the operation, which can
lead to interpretation errors difficult to estimate. Therefore, spectra decomposition
cannot be a random operation and should be carried out in accordance with a
unified and logical procedure. The separation procedure for glass spectra proposed
by Handke and Mozgawa [19] consists of the following operations:
• deconvolution and second derivative of the initial spectrum, initial parameters,
and preliminary number of peaks;
• simulation of pseudo-spectra for an analogous crystalline material and subtraction from the glass spectrum, final number, and peak parameters;
• proper decomposition;
• minimalization of the number of component bands with the largest degree of
fitting complex spectra with the original spectrum;
• comparison with the initial spectrum of the crystalline material;
• ascribing a physical meaning to the bands obtained as a result of decomposition.
Mathematical procedures dedicated to the issue of spectrum decomposition were
developed in the form of several algorithms and corresponding, constantly developed, computer programs [37, 38]. In this work, the Spectra-Calc (SC) program of
Galactic Industries Corp. was used.
In order to decompose spectra, the following output parameters are entered:
number of peaks, their position, full width at half maximum, relative intensity, and
shape expressed by the appropriate function. This data is initially determined on the
basis of two mathematical procedures: calculation of the spectrum’s second
derivative and deconvolution carried out in accordance with the method proposed
by Griffith and Pariente [36]. The spectrum’s second derivative allows for determining inflection points and for precisely determining the positions of band maxima. Similar information along with subsequent spectra parameters—full width at
half maximum, absolute intensity—is obtained with the help of the deconvolution
operation. As a result of this action, separate peaks are formed by the program in
maxima positions and inflection points of the spectrum. The algorithm of this
operation is based on the theory of Fourier cosine transform [36], in which the
function established after deconvolution is described by the following formula:
15 Spectroscopic Characterization of Silicate Amorphous Materials
465