

they enable selective reduction of noble metal ions directly in the synthesis process.
This phenomenon, described by thermochemical reduction, was included in
research in order to obtain the effect of enhancing the luminescence signal through
the Local Field Effect. For the study, the SGS glass was fabricated with the
chemical composition: 25Sb 2 O 3 –25Ge 2 O 3 –5Al 2 O 3 –5Na 2 O–40SiO 2 , co-doped with
0.8 mol% Er 2 O 3 and AgNO 3 ions successively from 0; 0.1; 0.2; and 0.4 mol% [32].
Due to the complex structure of their energy levels, erbium ions are one of the most
recognizable and known elements, which in addition to their significant attribute of
offering optical amplification in the III telecommunications window (EDFA
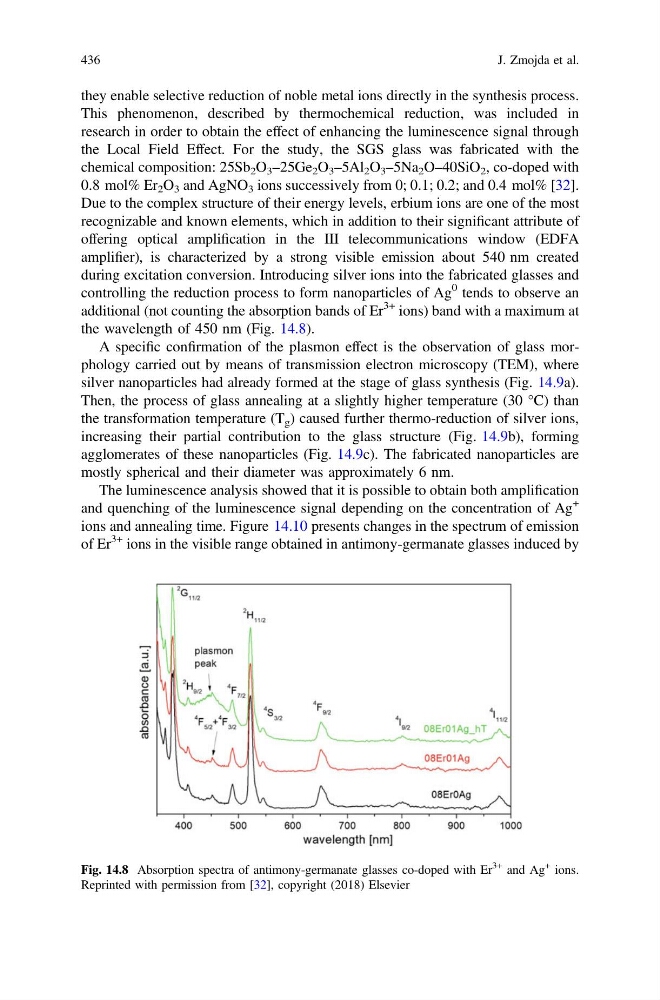
amplifier), is characterized by a strong visible emission about 540 nm created
during excitation conversion. Introducing silver ions into the fabricated glasses and
controlling the reduction process to form nanoparticles of Ag
0 tends to observe an
additional (not counting the absorption bands of Er
3+ ions) band with a maximum at
the wavelength of 450 nm (Fig. 14.8).
A specific confirmation of the plasmon effect is the observation of glass morphology carried out by means of transmission electron microscopy (TEM), where
silver nanoparticles had already formed at the stage of glass synthesis (Fig. 14.9a).
Then, the process of glass annealing at a slightly higher temperature (30 °C) than
the transformation temperature (T g ) caused further thermo-reduction of silver ions,
increasing their partial contribution to the glass structure (Fig. 14.9b), forming
agglomerates of these nanoparticles (Fig. 14.9c). The fabricated nanoparticles are
mostly spherical and their diameter was approximately 6 nm.
The luminescence analysis showed that it is possible to obtain both amplification
and quenching of the luminescence signal depending on the concentration of Ag
+
ions and annealing time. Figure 14.10 presents changes in the spectrum of emission
of Er
3+ ions in the visible range obtained in antimony-germanate glasses induced by
Fig. 14.8 Absorption spectra of antimony-germanate glasses co-doped with Er
3+ and Ag
+ ions.
Reprinted with permission from [32], copyright (2018) Elsevier
436
J. Zmojda et al.
This phenomenon, described by thermochemical reduction, was included in
research in order to obtain the effect of enhancing the luminescence signal through
the Local Field Effect. For the study, the SGS glass was fabricated with the
chemical composition: 25Sb 2 O 3 –25Ge 2 O 3 –5Al 2 O 3 –5Na 2 O–40SiO 2 , co-doped with
0.8 mol% Er 2 O 3 and AgNO 3 ions successively from 0; 0.1; 0.2; and 0.4 mol% [32].
Due to the complex structure of their energy levels, erbium ions are one of the most
recognizable and known elements, which in addition to their significant attribute of
offering optical amplification in the III telecommunications window (EDFA
amplifier), is characterized by a strong visible emission about 540 nm created
during excitation conversion. Introducing silver ions into the fabricated glasses and
controlling the reduction process to form nanoparticles of Ag
0 tends to observe an
additional (not counting the absorption bands of Er
3+ ions) band with a maximum at
the wavelength of 450 nm (Fig. 14.8).
A specific confirmation of the plasmon effect is the observation of glass morphology carried out by means of transmission electron microscopy (TEM), where
silver nanoparticles had already formed at the stage of glass synthesis (Fig. 14.9a).
Then, the process of glass annealing at a slightly higher temperature (30 °C) than
the transformation temperature (T g ) caused further thermo-reduction of silver ions,
increasing their partial contribution to the glass structure (Fig. 14.9b), forming
agglomerates of these nanoparticles (Fig. 14.9c). The fabricated nanoparticles are
mostly spherical and their diameter was approximately 6 nm.
The luminescence analysis showed that it is possible to obtain both amplification
and quenching of the luminescence signal depending on the concentration of Ag
+
ions and annealing time. Figure 14.10 presents changes in the spectrum of emission
of Er
3+ ions in the visible range obtained in antimony-germanate glasses induced by
Fig. 14.8 Absorption spectra of antimony-germanate glasses co-doped with Er
3+ and Ag
+ ions.
Reprinted with permission from [32], copyright (2018) Elsevier
436
J. Zmojda et al.