

• 1060–860 cm
−1 —antisymmetric stretching m as Si–O
− ;
• 850–820 cm
−1
—symmetric stretching m s Si–O
− ;
• 650–500 cm
−1 and 440–400 cm
−1
—bending d O–Si–O.
Much more useful model is the presented silicon bridge (Fig. 10.2b). Comparing
to the spectra of monosilicates and the above-mentioned types of normal vibrations,
in disilicate spectra there are additional bands in the range 700–650 cm
−1 coming
from bridge stretching vibrations [30]. A detailed analysis of the vibrations of this
system showed that it is possible to clearly distinguish the vibrations of the Si–O–Si
bridge from the vibrations of the O–Si–O bridge within the tetrahedron [31]. This is
confirmed by the difference in strength and charge distribution between the bridge
and terminal bonds [24, 29].
In cyclosilicates, another group of bands called “ring” bands appears in a similar
range of wave numbers (800–600 cm
−1 ) [30, 32, 33]. Characteristic ring vibrations
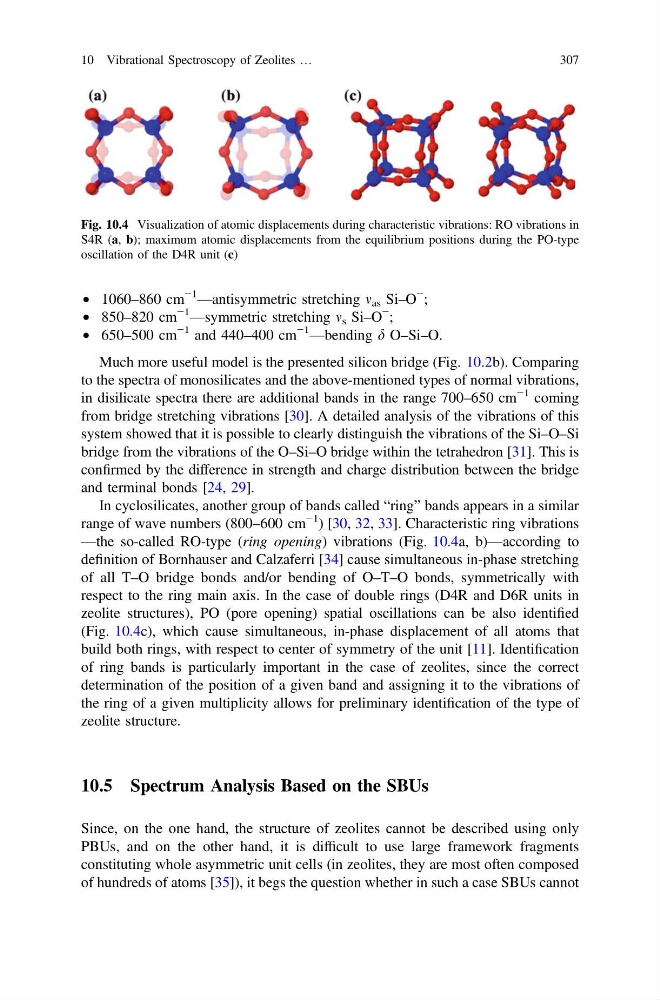
—the so-called RO-type (ring opening) vibrations (Fig. 10.4a, b)—according to
definition of Bornhauser and Calzaferri [34] cause simultaneous in-phase stretching
of all T–O bridge bonds and/or bending of O–T–O bonds, symmetrically with
respect to the ring main axis. In the case of double rings (D4R and D6R units in
zeolite structures), PO (pore opening) spatial oscillations can be also identified
(Fig. 10.4c), which cause simultaneous, in-phase displacement of all atoms that
build both rings, with respect to center of symmetry of the unit [11]. Identification
of ring bands is particularly important in the case of zeolites, since the correct
determination of the position of a given band and assigning it to the vibrations of
the ring of a given multiplicity allows for preliminary identification of the type of
zeolite structure.
10.5 Spectrum Analysis Based on the SBUs
Since, on the one hand, the structure of zeolites cannot be described using only
PBUs, and on the other hand, it is difficult to use large framework fragments
constituting whole asymmetric unit cells (in zeolites, they are most often composed
of hundreds of atoms [35]), it begs the question whether in such a case SBUs cannot
Fig. 10.4 Visualization of atomic displacements during characteristic vibrations: RO vibrations in
S4R (a, b); maximum atomic displacements from the equilibrium positions during the PO-type
oscillation of the D4R unit (c)
10 Vibrational Spectroscopy of Zeolites …
307
−1 —antisymmetric stretching m as Si–O
− ;
• 850–820 cm
−1
—symmetric stretching m s Si–O
− ;
• 650–500 cm
−1 and 440–400 cm
−1
—bending d O–Si–O.
Much more useful model is the presented silicon bridge (Fig. 10.2b). Comparing
to the spectra of monosilicates and the above-mentioned types of normal vibrations,
in disilicate spectra there are additional bands in the range 700–650 cm
−1 coming
from bridge stretching vibrations [30]. A detailed analysis of the vibrations of this
system showed that it is possible to clearly distinguish the vibrations of the Si–O–Si
bridge from the vibrations of the O–Si–O bridge within the tetrahedron [31]. This is
confirmed by the difference in strength and charge distribution between the bridge
and terminal bonds [24, 29].
In cyclosilicates, another group of bands called “ring” bands appears in a similar
range of wave numbers (800–600 cm
−1 ) [30, 32, 33]. Characteristic ring vibrations
—the so-called RO-type (ring opening) vibrations (Fig. 10.4a, b)—according to
definition of Bornhauser and Calzaferri [34] cause simultaneous in-phase stretching
of all T–O bridge bonds and/or bending of O–T–O bonds, symmetrically with
respect to the ring main axis. In the case of double rings (D4R and D6R units in
zeolite structures), PO (pore opening) spatial oscillations can be also identified
(Fig. 10.4c), which cause simultaneous, in-phase displacement of all atoms that
build both rings, with respect to center of symmetry of the unit [11]. Identification
of ring bands is particularly important in the case of zeolites, since the correct
determination of the position of a given band and assigning it to the vibrations of
the ring of a given multiplicity allows for preliminary identification of the type of
zeolite structure.
10.5 Spectrum Analysis Based on the SBUs
Since, on the one hand, the structure of zeolites cannot be described using only
PBUs, and on the other hand, it is difficult to use large framework fragments
constituting whole asymmetric unit cells (in zeolites, they are most often composed
of hundreds of atoms [35]), it begs the question whether in such a case SBUs cannot
Fig. 10.4 Visualization of atomic displacements during characteristic vibrations: RO vibrations in
S4R (a, b); maximum atomic displacements from the equilibrium positions during the PO-type
oscillation of the D4R unit (c)
10 Vibrational Spectroscopy of Zeolites …
307