

of hydration found for the group, which interacts with water the strongest, results
from the low accessibility of carbonyl groups hindered by the oligoether part. Even
a small, hydrophobic, a-methyl group may influence C=O hydration, as Maeda
showed by comparing determined by the IR analysis a hydration degree of analogous acrylates and methacrylates [159]. It is also worth noticing that in the case of
diluted solutions of linear PMEO 2 MA (the system with the water content inaccessible for PMEO 2 MA gels), the C=O groups hydrated by two water molecules
were also found instead of the simultaneous presence of 40% non-hydrated carbonyl groups. Their presence was manifested by the stronger shift of C=O line
towards a lower wavenumber (line 1698 cm
−1 ) [146].
Another interesting issue is the relation between the water structure and the
hydration degree in polymer gels. In the previous section, it was mentioned that the
ratio between the intensities of 3400 and 3200 cm
−1 Raman lines may be used to
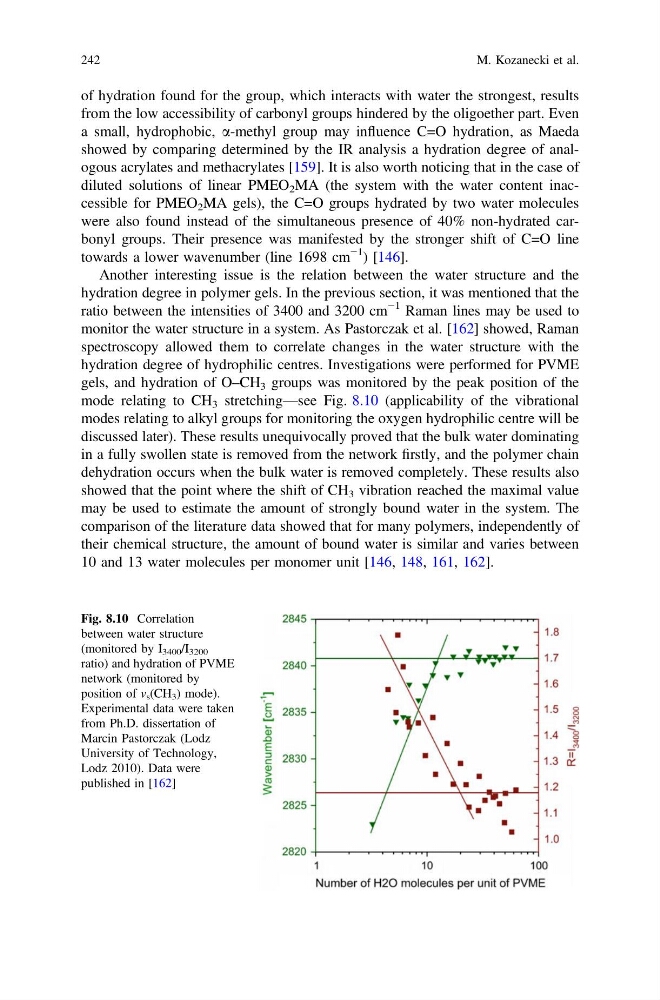
monitor the water structure in a system. As Pastorczak et al. [162] showed, Raman
spectroscopy allowed them to correlate changes in the water structure with the
hydration degree of hydrophilic centres. Investigations were performed for PVME
gels, and hydration of O–CH 3 groups was monitored by the peak position of the
mode relating to CH 3 stretching—see Fig. 8.10 (applicability of the vibrational
modes relating to alkyl groups for monitoring the oxygen hydrophilic centre will be
discussed later). These results unequivocally proved that the bulk water dominating
in a fully swollen state is removed from the network firstly, and the polymer chain
dehydration occurs when the bulk water is removed completely. These results also
showed that the point where the shift of CH 3 vibration reached the maximal value
may be used to estimate the amount of strongly bound water in the system. The
comparison of the literature data showed that for many polymers, independently of
their chemical structure, the amount of bound water is similar and varies between
10 and 13 water molecules per monomer unit [146, 148, 161, 162].
Fig. 8.10 Correlation
between water structure
(monitored by I 3400 /I 3200
ratio) and hydration of PVME
network (monitored by
position of v s (CH 3 ) mode).
Experimental data were taken
from Ph.D. dissertation of
Marcin Pastorczak (Lodz
University of Technology,
Lodz 2010). Data were
published in [162]
242
M. Kozanecki et al.
from the low accessibility of carbonyl groups hindered by the oligoether part. Even
a small, hydrophobic, a-methyl group may influence C=O hydration, as Maeda
showed by comparing determined by the IR analysis a hydration degree of analogous acrylates and methacrylates [159]. It is also worth noticing that in the case of
diluted solutions of linear PMEO 2 MA (the system with the water content inaccessible for PMEO 2 MA gels), the C=O groups hydrated by two water molecules
were also found instead of the simultaneous presence of 40% non-hydrated carbonyl groups. Their presence was manifested by the stronger shift of C=O line
towards a lower wavenumber (line 1698 cm
−1 ) [146].
Another interesting issue is the relation between the water structure and the
hydration degree in polymer gels. In the previous section, it was mentioned that the
ratio between the intensities of 3400 and 3200 cm
−1 Raman lines may be used to
monitor the water structure in a system. As Pastorczak et al. [162] showed, Raman
spectroscopy allowed them to correlate changes in the water structure with the
hydration degree of hydrophilic centres. Investigations were performed for PVME
gels, and hydration of O–CH 3 groups was monitored by the peak position of the
mode relating to CH 3 stretching—see Fig. 8.10 (applicability of the vibrational
modes relating to alkyl groups for monitoring the oxygen hydrophilic centre will be
discussed later). These results unequivocally proved that the bulk water dominating
in a fully swollen state is removed from the network firstly, and the polymer chain
dehydration occurs when the bulk water is removed completely. These results also
showed that the point where the shift of CH 3 vibration reached the maximal value
may be used to estimate the amount of strongly bound water in the system. The
comparison of the literature data showed that for many polymers, independently of
their chemical structure, the amount of bound water is similar and varies between
10 and 13 water molecules per monomer unit [146, 148, 161, 162].
Fig. 8.10 Correlation
between water structure
(monitored by I 3400 /I 3200
ratio) and hydration of PVME
network (monitored by
position of v s (CH 3 ) mode).
Experimental data were taken
from Ph.D. dissertation of
Marcin Pastorczak (Lodz
University of Technology,
Lodz 2010). Data were
published in [162]
242
M. Kozanecki et al.