

where A is an integral intensity and e—absorption coefficient (indices 1709 and
1728 correspond to wavenumbers of absorption maxima characteristic for
H-bonded and non-bonded C=O groups).
It was shown that for linear PMEO 2 MA, only 50–60% of C=O groups are
hydrated even below LCST [146], while for gels this value is lower and equals ca.
40% independently of the network architecture [161]. This surprisingly low degree
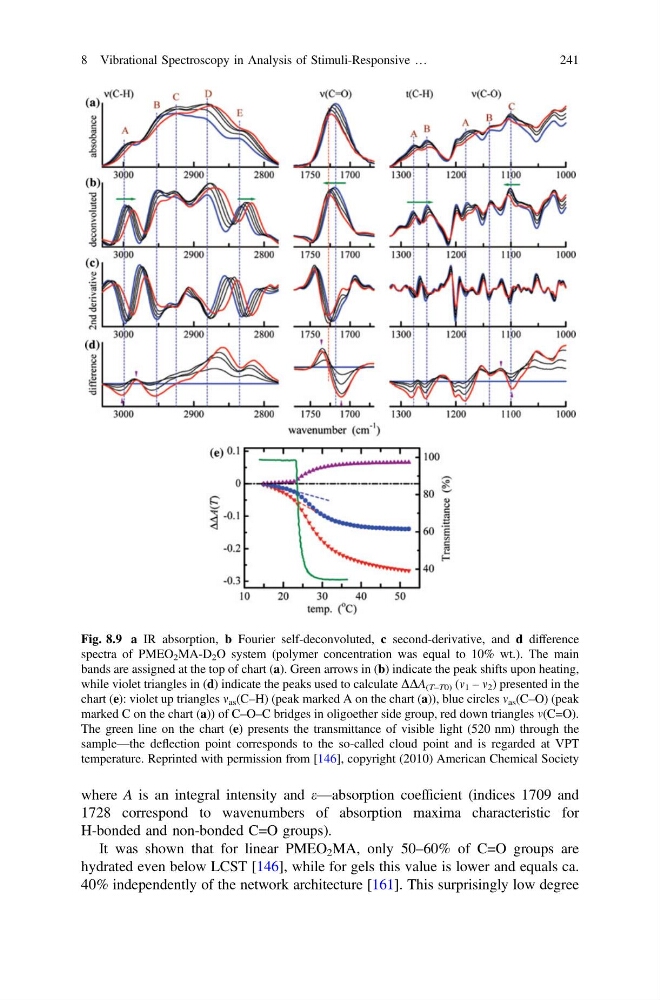
Fig. 8.9 a IR absorption, b Fourier self-deconvoluted, c second-derivative, and d difference
spectra of PMEO 2 MA-D 2 O system (polymer concentration was equal to 10% wt.). The main
bands are assigned at the top of chart (a). Green arrows in (b) indicate the peak shifts upon heating,
while violet triangles in (d) indicate the peaks used to calculate DDA (T–T0) (m 1 – m 2 ) presented in the
chart (e): violet up triangles m as (C–H) (peak marked A on the chart (a)), blue circles m as (C–O) (peak
marked C on the chart (a)) of C–O–C bridges in oligoether side group, red down triangles m(C=O).
The green line on the chart (e) presents the transmittance of visible light (520 nm) through the
sample—the deflection point corresponds to the so-called cloud point and is regarded at VPT
temperature. Reprinted with permission from [146], copyright (2010) American Chemical Society
8 Vibrational Spectroscopy in Analysis of Stimuli-Responsive …
241
1728 correspond to wavenumbers of absorption maxima characteristic for
H-bonded and non-bonded C=O groups).
It was shown that for linear PMEO 2 MA, only 50–60% of C=O groups are
hydrated even below LCST [146], while for gels this value is lower and equals ca.
40% independently of the network architecture [161]. This surprisingly low degree
Fig. 8.9 a IR absorption, b Fourier self-deconvoluted, c second-derivative, and d difference
spectra of PMEO 2 MA-D 2 O system (polymer concentration was equal to 10% wt.). The main
bands are assigned at the top of chart (a). Green arrows in (b) indicate the peak shifts upon heating,
while violet triangles in (d) indicate the peaks used to calculate DDA (T–T0) (m 1 – m 2 ) presented in the
chart (e): violet up triangles m as (C–H) (peak marked A on the chart (a)), blue circles m as (C–O) (peak
marked C on the chart (a)) of C–O–C bridges in oligoether side group, red down triangles m(C=O).
The green line on the chart (e) presents the transmittance of visible light (520 nm) through the
sample—the deflection point corresponds to the so-called cloud point and is regarded at VPT
temperature. Reprinted with permission from [146], copyright (2010) American Chemical Society
8 Vibrational Spectroscopy in Analysis of Stimuli-Responsive …
241