

calculated Raman spectra for the three conformers of IDI, summed according to the
relative abundance of the conformers in the crystalline state. As seen in Fig. 7.10,
these two spectra show a very good agreement, indicating that the intermolecular
potential in the crystalline phase does not affect too much the intramolecular
potentials, and also that the intermolecular hydrogen bonds involving conformer 1
in the crystal are comparable in strength to the intramolecular hydrogen bond
existing in the isolated molecule. The strong overlapping doublet of bands observed
at 331/326 cm
−1 is characteristic of the m S–S stretching vibration, and its frequency
is well reproduced by the calculations (scaled value).
Figure 7.10 shows also the calculated Raman spectrum of conformer 2, which is
the one existing in polymorph I, for which the experimental spectrum has not yet
been reported. Assuming that the predicted spectrum of 2 would also fit properly
the experimental spectrum of polymorph I, one can expect that the spectrum of that
polymorph could be easily distinguishable from that of polymorph II by direct
comparison of the spectral region shown in the figure. For example, the doublets
observed in the Raman spectrum of polymorph II at 176/167, 226/222, 240/
236 cm
−1 and the overlapped doublet at 331/326 cm
−1 can be expected to be
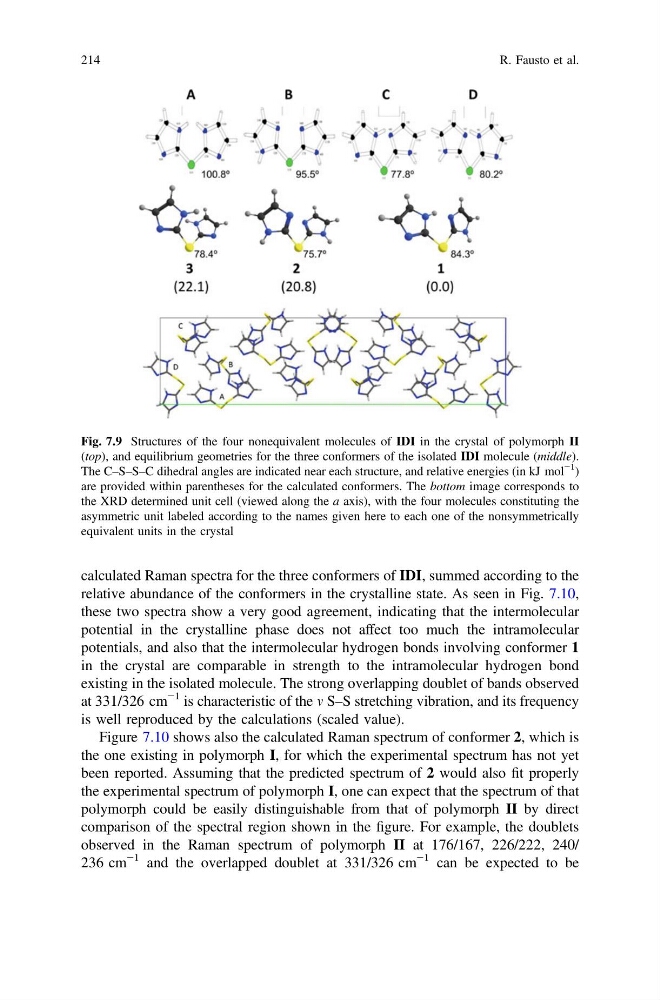
Fig. 7.9 Structures of the four nonequivalent molecules of IDI in the crystal of polymorph II
(top), and equilibrium geometries for the three conformers of the isolated IDI molecule (middle).
The C–S–S–C dihedral angles are indicated near each structure, and relative energies (in kJ mol
−1
)
are provided within parentheses for the calculated conformers. The bottom image corresponds to
the XRD determined unit cell (viewed along the a axis), with the four molecules constituting the
asymmetric unit labeled according to the names given here to each one of the nonsymmetrically
equivalent units in the crystal
214
R. Fausto et al.
relative abundance of the conformers in the crystalline state. As seen in Fig. 7.10,
these two spectra show a very good agreement, indicating that the intermolecular
potential in the crystalline phase does not affect too much the intramolecular
potentials, and also that the intermolecular hydrogen bonds involving conformer 1
in the crystal are comparable in strength to the intramolecular hydrogen bond
existing in the isolated molecule. The strong overlapping doublet of bands observed
at 331/326 cm
−1 is characteristic of the m S–S stretching vibration, and its frequency
is well reproduced by the calculations (scaled value).
Figure 7.10 shows also the calculated Raman spectrum of conformer 2, which is
the one existing in polymorph I, for which the experimental spectrum has not yet
been reported. Assuming that the predicted spectrum of 2 would also fit properly
the experimental spectrum of polymorph I, one can expect that the spectrum of that
polymorph could be easily distinguishable from that of polymorph II by direct
comparison of the spectral region shown in the figure. For example, the doublets
observed in the Raman spectrum of polymorph II at 176/167, 226/222, 240/
236 cm
−1 and the overlapped doublet at 331/326 cm
−1 can be expected to be
Fig. 7.9 Structures of the four nonequivalent molecules of IDI in the crystal of polymorph II
(top), and equilibrium geometries for the three conformers of the isolated IDI molecule (middle).
The C–S–S–C dihedral angles are indicated near each structure, and relative energies (in kJ mol
−1
)
are provided within parentheses for the calculated conformers. The bottom image corresponds to
the XRD determined unit cell (viewed along the a axis), with the four molecules constituting the
asymmetric unit labeled according to the names given here to each one of the nonsymmetrically
equivalent units in the crystal
214
R. Fausto et al.