

before the cell. The laser beam at the fundamental frequency is then focused in the cell
whose walls are made of quartz in order to obtain an excellent transmission at the
harmonic frequency around 400 nm by a microscope objective X10 with numerical
aperture NA = 0.25. The scattered intensity is then collected at right angles using a
lens with a focal length of 50 mm and separated from the fundamental intensity
scattered by a high-pass filter. A polarization analysis system, consisting of a
half-wave plate and a polarizing cube adapted to the wavelength of 400 nm, is placed
on the detection line in order to select a polarization state defined by the diffused
harmonic wave. The intensity at the harmonic frequency is then detected, using a
photomultiplier tube placed at the output of a spectrometer.
A spectrometer makes it possible to choose the range of length of the collected
signal and to obtain the TPEF spectrum or the SHG signal.
Recently, we developed a “tout-en-un” experimental setup able to record TPA,
TPEF cross sections along with the first hyperpolarizability b values for liganded
silver and gold quantum clusters [10–12, 58, 59].
The light source for the present TPA experiments was the same as the above.
The beam was gently focused by a 5 cm focal lens and sent in transmission into a
0.5 cm path length spectrophotometric cuvette. The transmitted light was detected
with a large aperture photodiode. The incident power was controlled with a
half-wave plate and a polarizing cube. The sample absorption was then determined
as a function of the incident power. Fluorescein was used as a reference to determine the beam waist at focus in particular. The calibration of the photodiode signal
was obtained with a neat water cuvette through a variation of the incident power. As
expected with a distilled water cuvette, the plot of the transmitted light versus the
incident light exhibits a linear behavior, whereas in the presence of the nanoclusters, a decrease of the transmitted intensity is observed as the absorption increases
due to the nonlinear contribution (Fig. 5.7).
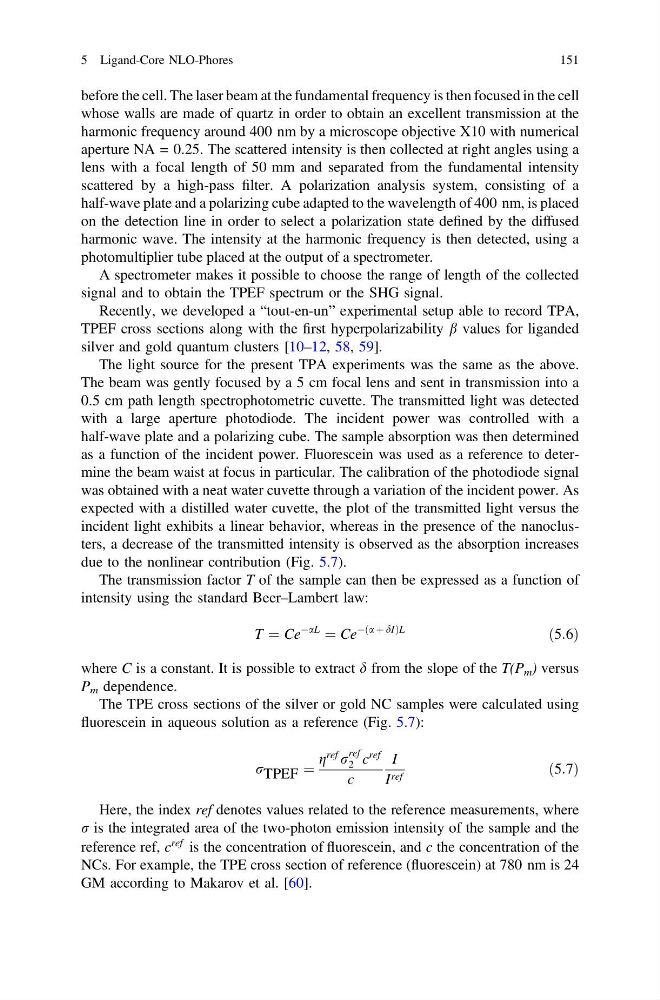
The transmission factor T of the sample can then be expressed as a function of
intensity using the standard Beer–Lambert law:
T ¼ Ce
ÀaL
¼ Ce
Àða þ dIÞL
ð5:6Þ
where C is a constant. It is possible to extract d from the slope of the T(P m ) versus
P m dependence.
The TPE cross sections of the silver or gold NC samples were calculated using
fluorescein in aqueous solution as a reference (Fig. 5.7):
r TPEF ¼
g
ref r
ref
2 c
ref
c
I
I ref
ð5:7Þ
Here, the index ref denotes values related to the reference measurements, where
r is the integrated area of the two-photon emission intensity of the sample and the
reference ref, c
ref is the concentration of fluorescein, and c the concentration of the
NCs. For example, the TPE cross section of reference (fluorescein) at 780 nm is 24
GM according to Makarov et al. [60].
5 Ligand-Core NLO-Phores
151
whose walls are made of quartz in order to obtain an excellent transmission at the
harmonic frequency around 400 nm by a microscope objective X10 with numerical
aperture NA = 0.25. The scattered intensity is then collected at right angles using a
lens with a focal length of 50 mm and separated from the fundamental intensity
scattered by a high-pass filter. A polarization analysis system, consisting of a
half-wave plate and a polarizing cube adapted to the wavelength of 400 nm, is placed
on the detection line in order to select a polarization state defined by the diffused
harmonic wave. The intensity at the harmonic frequency is then detected, using a
photomultiplier tube placed at the output of a spectrometer.
A spectrometer makes it possible to choose the range of length of the collected
signal and to obtain the TPEF spectrum or the SHG signal.
Recently, we developed a “tout-en-un” experimental setup able to record TPA,
TPEF cross sections along with the first hyperpolarizability b values for liganded
silver and gold quantum clusters [10–12, 58, 59].
The light source for the present TPA experiments was the same as the above.
The beam was gently focused by a 5 cm focal lens and sent in transmission into a
0.5 cm path length spectrophotometric cuvette. The transmitted light was detected
with a large aperture photodiode. The incident power was controlled with a
half-wave plate and a polarizing cube. The sample absorption was then determined
as a function of the incident power. Fluorescein was used as a reference to determine the beam waist at focus in particular. The calibration of the photodiode signal
was obtained with a neat water cuvette through a variation of the incident power. As
expected with a distilled water cuvette, the plot of the transmitted light versus the
incident light exhibits a linear behavior, whereas in the presence of the nanoclusters, a decrease of the transmitted intensity is observed as the absorption increases
due to the nonlinear contribution (Fig. 5.7).
The transmission factor T of the sample can then be expressed as a function of
intensity using the standard Beer–Lambert law:
T ¼ Ce
ÀaL
¼ Ce
Àða þ dIÞL
ð5:6Þ
where C is a constant. It is possible to extract d from the slope of the T(P m ) versus
P m dependence.
The TPE cross sections of the silver or gold NC samples were calculated using
fluorescein in aqueous solution as a reference (Fig. 5.7):
r TPEF ¼
g
ref r
ref
2 c
ref
c
I
I ref
ð5:7Þ
Here, the index ref denotes values related to the reference measurements, where
r is the integrated area of the two-photon emission intensity of the sample and the
reference ref, c
ref is the concentration of fluorescein, and c the concentration of the
NCs. For example, the TPE cross section of reference (fluorescein) at 780 nm is 24
GM according to Makarov et al. [60].
5 Ligand-Core NLO-Phores
151