

6.5 Water, Energy, Food
101
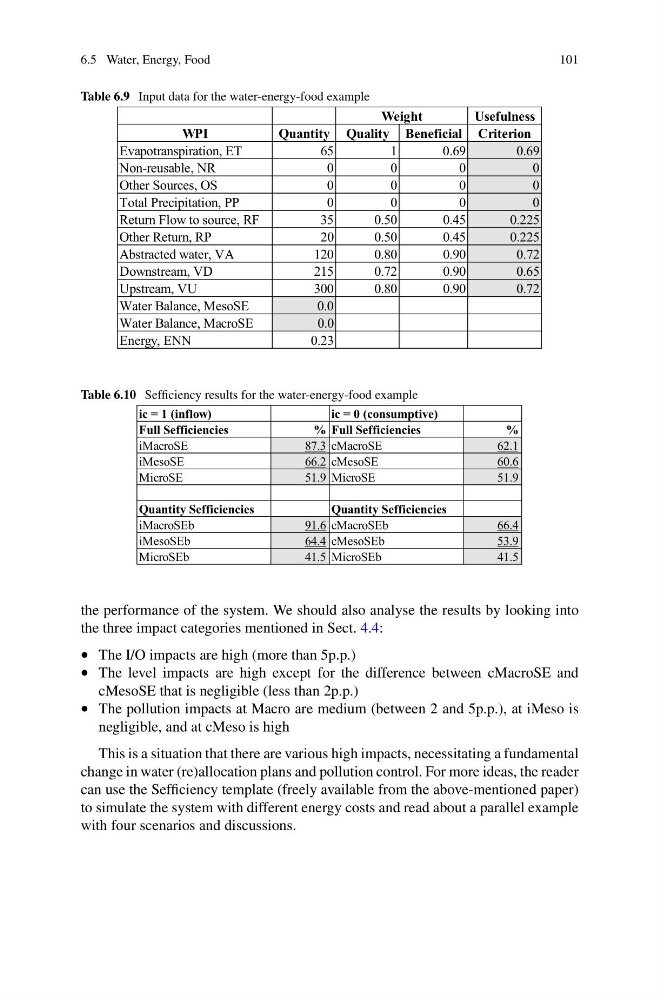
Table 6.9 Input data for the water-energy-food example
Usefulness
WPI
Quantity Quality Beneficial Criterion
Evapotranspiration, ET
65
1
0.69
0.69
Non-reusable, NR
0
0
0
0
Other Sources, OS
0
0
0
0
Total Precipitation, PP
0
0
0
0
Return Flow to source, RF
35
0.50
0.45
0.225
Other Return, RP
20
0.50
0.45
0.225
Abstracted water, VA
120
0.80
0.90
0.72
Downstream, VD
215
0.72
0.90
0.65
Upstream, VU
300
0.80
0.90
0.72
Water Balance, MesoSE
0.0
Water Balance, MacroSE
0.0
Energy, ENN
0.23
Weight
Table 6.10 Sefficiency results for the water-energy-food example
ic = 1 (inflow)
ic = 0 (consumptive)
Full Sefficiencies
% Full Sefficiencies
%
iMacroSE
87.3 cMacroSE
62.1
iMesoSE
66.2 cMesoSE
60.6
MicroSE
51.9 MicroSE
51.9
Quantity Sefficiencies
Quantity Sefficiencies
iMacroSEb
91.6 cMacroSEb
66.4
iMesoSEb
64.4 cMesoSEb
53.9
MicroSEb
41.5 MicroSEb
41.5
the performance of the system. We should also analyse the results by looking into
the three impact categories mentioned in Sect. 4.4:
• The I/O impacts are high (more than 5p.p.)
• The level impacts are high except for the difference between cMacroSE and
cMesoSE that is negligible (less than 2p.p.)
• The pollution impacts at Macro are medium (between 2 and 5p.p.), at iMeso is
negligible, and at cMeso is high
This is a situation that there are various high impacts, necessitating a fundamental
change in water (re)allocation plans and pollution control. For more ideas, the reader
can use the Sefficiency template (freely available from the above-mentioned paper)
to simulate the system with different energy costs and read about a parallel example
with four scenarios and discussions.
101
Table 6.9 Input data for the water-energy-food example
Usefulness
WPI
Quantity Quality Beneficial Criterion
Evapotranspiration, ET
65
1
0.69
0.69
Non-reusable, NR
0
0
0
0
Other Sources, OS
0
0
0
0
Total Precipitation, PP
0
0
0
0
Return Flow to source, RF
35
0.50
0.45
0.225
Other Return, RP
20
0.50
0.45
0.225
Abstracted water, VA
120
0.80
0.90
0.72
Downstream, VD
215
0.72
0.90
0.65
Upstream, VU
300
0.80
0.90
0.72
Water Balance, MesoSE
0.0
Water Balance, MacroSE
0.0
Energy, ENN
0.23
Weight
Table 6.10 Sefficiency results for the water-energy-food example
ic = 1 (inflow)
ic = 0 (consumptive)
Full Sefficiencies
% Full Sefficiencies
%
iMacroSE
87.3 cMacroSE
62.1
iMesoSE
66.2 cMesoSE
60.6
MicroSE
51.9 MicroSE
51.9
Quantity Sefficiencies
Quantity Sefficiencies
iMacroSEb
91.6 cMacroSEb
66.4
iMesoSEb
64.4 cMesoSEb
53.9
MicroSEb
41.5 MicroSEb
41.5
the performance of the system. We should also analyse the results by looking into
the three impact categories mentioned in Sect. 4.4:
• The I/O impacts are high (more than 5p.p.)
• The level impacts are high except for the difference between cMacroSE and
cMesoSE that is negligible (less than 2p.p.)
• The pollution impacts at Macro are medium (between 2 and 5p.p.), at iMeso is
negligible, and at cMeso is high
This is a situation that there are various high impacts, necessitating a fundamental
change in water (re)allocation plans and pollution control. For more ideas, the reader
can use the Sefficiency template (freely available from the above-mentioned paper)
to simulate the system with different energy costs and read about a parallel example
with four scenarios and discussions.