

correction [48]. An overestimation on the closer range gates can worsen the attenuation correction for range gates further away. Attenuation correction procedures
can be greatly improved if the total path-integrated attenuation is available as a
constraint, for example, using dual-frequency radars or dual-polarization radars.
Advances in polarimetric weather radar technology can provide additional phase
measurements that can be used to correct reflectivity measurements for rain attenuation at C-band and X-band frequencies [51]. The attenuation can be estimated by
calculating the total differential propagation phase shift between the vertical and
horizontal orthogonal signals (Φ dp ). The total differential propagation phase shift
across a rain cell can be used as a constraint to estimate the PIA due to the fact that a
linear relation exists between the two at typical radar frequencies (3–10 GHz).
Differential phase measurements can be used to correct for attenuation in the
reflectivity using algorithms of the form A ¼ αK
β
dp [8], where K dp (specific differential phase) is the derivative of Φ dp along the range. However, the parameter α is
temperature dependent, but a technique has been developed to estimate this parameter in real-time and taking into account the total PIA as a constraint [52].
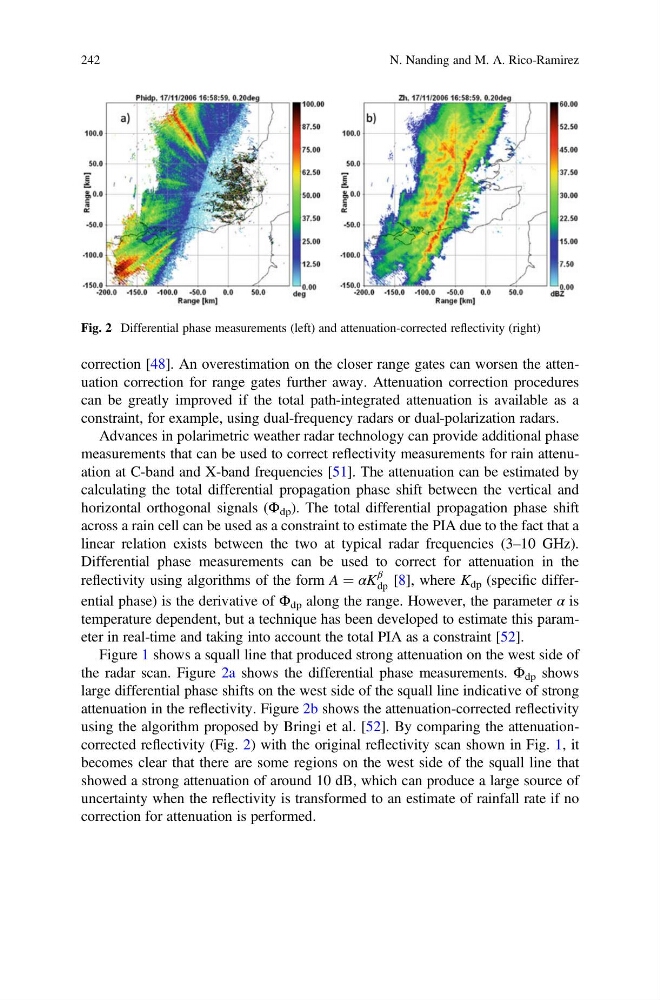
Figure 1 shows a squall line that produced strong attenuation on the west side of
the radar scan. Figure 2a shows the differential phase measurements. Φ dp shows
large differential phase shifts on the west side of the squall line indicative of strong
attenuation in the reflectivity. Figure 2b shows the attenuation-corrected reflectivity
using the algorithm proposed by Bringi et al. [52]. By comparing the attenuationcorrected reflectivity (Fig. 2) with the original reflectivity scan shown in Fig. 1, it
becomes clear that there are some regions on the west side of the squall line that
showed a strong attenuation of around 10 dB, which can produce a large source of
uncertainty when the reflectivity is transformed to an estimate of rainfall rate if no
correction for attenuation is performed.
Fig. 2 Differential phase measurements (left) and attenuation-corrected reflectivity (right)
242
N. Nanding and M. A. Rico-Ramirez
can be greatly improved if the total path-integrated attenuation is available as a
constraint, for example, using dual-frequency radars or dual-polarization radars.
Advances in polarimetric weather radar technology can provide additional phase
measurements that can be used to correct reflectivity measurements for rain attenuation at C-band and X-band frequencies [51]. The attenuation can be estimated by
calculating the total differential propagation phase shift between the vertical and
horizontal orthogonal signals (Φ dp ). The total differential propagation phase shift
across a rain cell can be used as a constraint to estimate the PIA due to the fact that a
linear relation exists between the two at typical radar frequencies (3–10 GHz).
Differential phase measurements can be used to correct for attenuation in the
reflectivity using algorithms of the form A ¼ αK
β
dp [8], where K dp (specific differential phase) is the derivative of Φ dp along the range. However, the parameter α is
temperature dependent, but a technique has been developed to estimate this parameter in real-time and taking into account the total PIA as a constraint [52].
Figure 1 shows a squall line that produced strong attenuation on the west side of
the radar scan. Figure 2a shows the differential phase measurements. Φ dp shows
large differential phase shifts on the west side of the squall line indicative of strong
attenuation in the reflectivity. Figure 2b shows the attenuation-corrected reflectivity
using the algorithm proposed by Bringi et al. [52]. By comparing the attenuationcorrected reflectivity (Fig. 2) with the original reflectivity scan shown in Fig. 1, it
becomes clear that there are some regions on the west side of the squall line that
showed a strong attenuation of around 10 dB, which can produce a large source of
uncertainty when the reflectivity is transformed to an estimate of rainfall rate if no
correction for attenuation is performed.
Fig. 2 Differential phase measurements (left) and attenuation-corrected reflectivity (right)
242
N. Nanding and M. A. Rico-Ramirez