

For each of them data of flow, pressure and energy use were available. Pressure is
not presented here. Flows (m
3 /h) have a time resolution of approximately 1 min,
while energy use (kWh) contains data with a time resolution of approximately
15 min. The available data covers the period between 01 January 2016 and
31 December 2017. Data delivered by the utility contains the system’s flag for
DQC. The flags are categorized as 0 and 1. A flag of 0 can be considered as Good
data, while flags of 1 considered as Faulty, Dubious or out of range data.
The time series of the flows are presented in Fig. 12 and the energy use in Fig. 13
discriminated for each pumping station. In such figures, the flag status of the utility
(Company A) is presented as red lines in the corresponding timestamp. If data is
considered as valid or Good, the red line has a value of zero. The proposed data
validation identified the timestamps at midnight as faulty data, but these have been
removed.
For flow time series (see Fig. 12), the largest amount of flags is found at PS OSD
(6,769 or 0.64% of the TS). The lowest number of flags is observed in the PS HLW
(41 or 0.004%). In the case of PS HLM (see Fig. 12e), in the period between March
2016 and May 2016, there is no data of flows, and this drop is not identified by the
system flags.
The total number of flags identified in the raw data for each pumping station and
variable is presented in Table 5. It is of notice that no anomalies are identified by
either the system of the water or the energy utility.
For energy time series, there are no flags identified by the system. The data is
provided by a third party. Energy use at PS HLM (Fig. 13e) displays drops during
extended period between February, March, April, and May 2016. After obtaining
feedback from the utility, it was confirmed that this period corresponds to a maintenance of the pumping station. In addition for OSD PS (Fig. 13d), raw data contains
a large number of pump switches (values ¼ 0). This can indicate no registering of
data or that indeed the pumps are shut off.
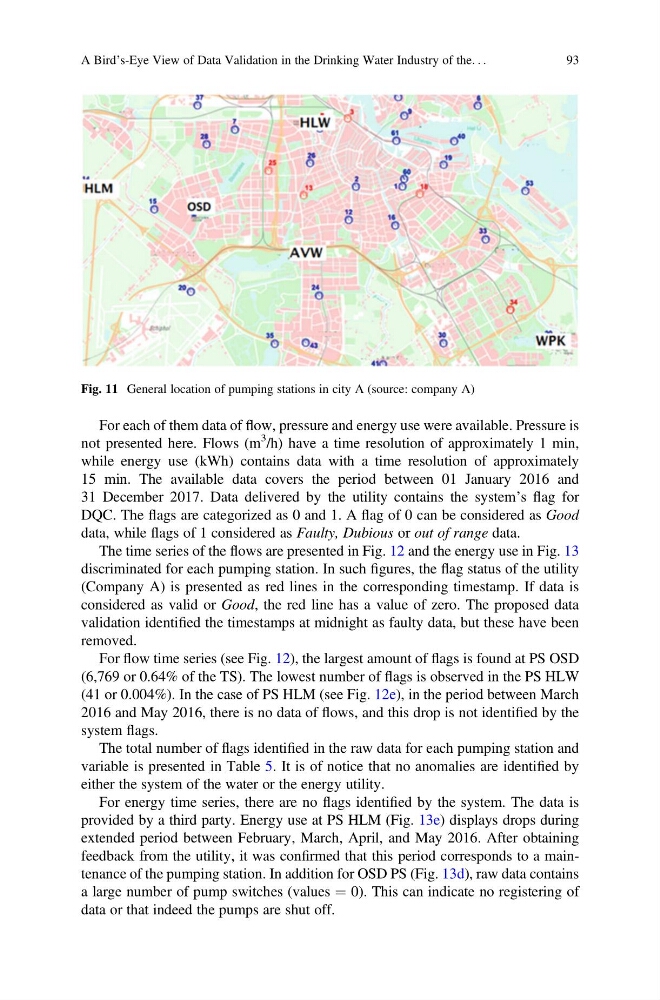
Fig. 11 General location of pumping stations in city A (source: company A)
A Bird’s-Eye View of Data Validation in the Drinking Water Industry of the. . .
93
not presented here. Flows (m
3 /h) have a time resolution of approximately 1 min,
while energy use (kWh) contains data with a time resolution of approximately
15 min. The available data covers the period between 01 January 2016 and
31 December 2017. Data delivered by the utility contains the system’s flag for
DQC. The flags are categorized as 0 and 1. A flag of 0 can be considered as Good
data, while flags of 1 considered as Faulty, Dubious or out of range data.
The time series of the flows are presented in Fig. 12 and the energy use in Fig. 13
discriminated for each pumping station. In such figures, the flag status of the utility
(Company A) is presented as red lines in the corresponding timestamp. If data is
considered as valid or Good, the red line has a value of zero. The proposed data
validation identified the timestamps at midnight as faulty data, but these have been
removed.
For flow time series (see Fig. 12), the largest amount of flags is found at PS OSD
(6,769 or 0.64% of the TS). The lowest number of flags is observed in the PS HLW
(41 or 0.004%). In the case of PS HLM (see Fig. 12e), in the period between March
2016 and May 2016, there is no data of flows, and this drop is not identified by the
system flags.
The total number of flags identified in the raw data for each pumping station and
variable is presented in Table 5. It is of notice that no anomalies are identified by
either the system of the water or the energy utility.
For energy time series, there are no flags identified by the system. The data is
provided by a third party. Energy use at PS HLM (Fig. 13e) displays drops during
extended period between February, March, April, and May 2016. After obtaining
feedback from the utility, it was confirmed that this period corresponds to a maintenance of the pumping station. In addition for OSD PS (Fig. 13d), raw data contains
a large number of pump switches (values ¼ 0). This can indicate no registering of
data or that indeed the pumps are shut off.
Fig. 11 General location of pumping stations in city A (source: company A)
A Bird’s-Eye View of Data Validation in the Drinking Water Industry of the. . .
93