

74
An exciting recent application of stable isotope technology is the cell-scale visualization of isotopic labelling made possible by nanoscale secondary ion mass spectrometry (nanoSIMS) (Finzi-Hart et al. 2009; Lechene et al. 2007; Taylor 2019).
Much like electron microscopy, it uses a high energy primary beam of ions to scan
microscopic materials, liberating secondary ions to form an image, but differs from
conventional electron microscopy by focusing the secondary ions to a mass spectrometer (Kilburn et al. 2010; Taylor 2019). Multiple stable isotopes (
12
C,
13
C,
14
N,
15
N,
16
O,
18
O,
31
P,
34
S) can be distinguished in high resolution images (Kilburn et al.
2010). NanoSIMS has been used for a variety of studies of elemental transfer, such
as Nitrogen, from grazing to symbiosis (Taylor 2019). Using this method, it is possible to identify
15
N 2 -fixing cells, or trace the movement of
15
N between cells or cell
structures (Bonnet et al. 2016; Dekas and Orphan 2011; Foster et al. 2011; Thompson
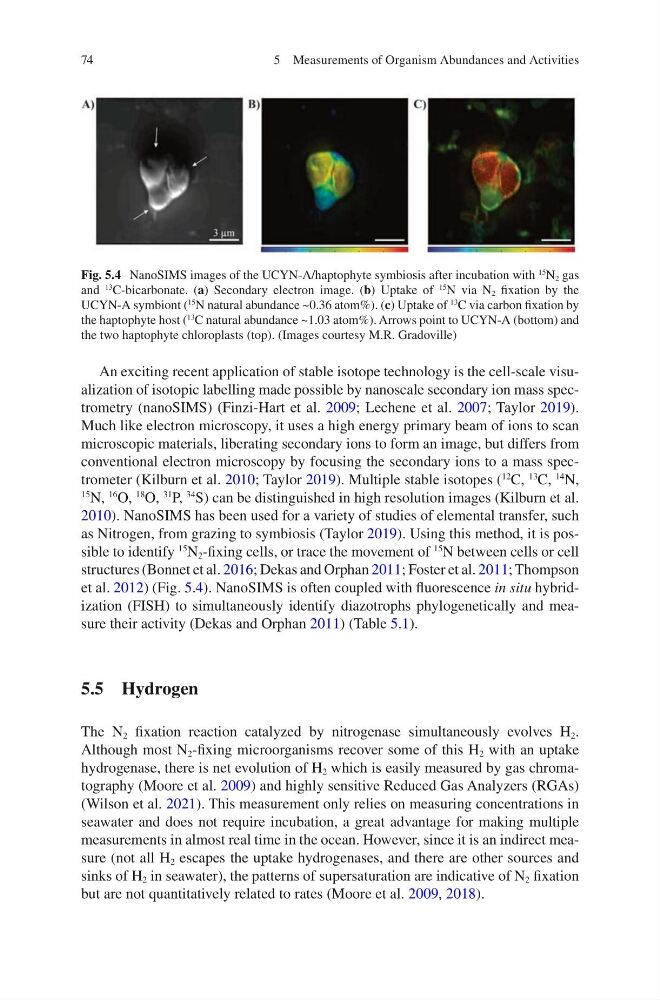
et al. 2012) (Fig. 5.4). NanoSIMS is often coupled with fluorescence in situ hybridization (FISH) to simultaneously identify diazotrophs phylogenetically and measure their activity (Dekas and Orphan 2011) (Table 5.1).
5.5 Hydrogen
The N 2 fixation reaction catalyzed by nitrogenase simultaneously evolves H 2 .
Although most N 2 -fixing microorganisms recover some of this H 2 with an uptake
hydrogenase, there is net evolution of H 2 which is easily measured by gas chromatography (Moore et al. 2009) and highly sensitive Reduced Gas Analyzers (RGAs)
(Wilson et al. 2021). This measurement only relies on measuring concentrations in
seawater and does not require incubation, a great advantage for making multiple
measurements in almost real time in the ocean. However, since it is an indirect measure (not all H 2 escapes the uptake hydrogenases, and there are other sources and
sinks of H 2 in seawater), the patterns of supersaturation are indicative of N 2 fixation
but are not quantitatively related to rates (Moore et al. 2009, 2018).
Fig. 5.4 NanoSIMS images of the UCYN-A/haptophyte symbiosis after incubation with
15
N 2 gas
and
13 C-bicarbonate. (a) Secondary electron image. (b) Uptake of
15 N via N 2 fixation by the
UCYN-A symbiont (
15
N natural abundance ~0.36 atom%). (c) Uptake of
13 C via carbon fixation by
the haptophyte host (
13
C natural abundance ~1.03 atom%). Arrows point to UCYN-A (bottom) and
the two haptophyte chloroplasts (top). (Images courtesy M.R. Gradoville)
5 Measurements of Organism Abundances and Activities
An exciting recent application of stable isotope technology is the cell-scale visualization of isotopic labelling made possible by nanoscale secondary ion mass spectrometry (nanoSIMS) (Finzi-Hart et al. 2009; Lechene et al. 2007; Taylor 2019).
Much like electron microscopy, it uses a high energy primary beam of ions to scan
microscopic materials, liberating secondary ions to form an image, but differs from
conventional electron microscopy by focusing the secondary ions to a mass spectrometer (Kilburn et al. 2010; Taylor 2019). Multiple stable isotopes (
12
C,
13
C,
14
N,
15
N,
16
O,
18
O,
31
P,
34
S) can be distinguished in high resolution images (Kilburn et al.
2010). NanoSIMS has been used for a variety of studies of elemental transfer, such
as Nitrogen, from grazing to symbiosis (Taylor 2019). Using this method, it is possible to identify
15
N 2 -fixing cells, or trace the movement of
15
N between cells or cell
structures (Bonnet et al. 2016; Dekas and Orphan 2011; Foster et al. 2011; Thompson
et al. 2012) (Fig. 5.4). NanoSIMS is often coupled with fluorescence in situ hybridization (FISH) to simultaneously identify diazotrophs phylogenetically and measure their activity (Dekas and Orphan 2011) (Table 5.1).
5.5 Hydrogen
The N 2 fixation reaction catalyzed by nitrogenase simultaneously evolves H 2 .
Although most N 2 -fixing microorganisms recover some of this H 2 with an uptake
hydrogenase, there is net evolution of H 2 which is easily measured by gas chromatography (Moore et al. 2009) and highly sensitive Reduced Gas Analyzers (RGAs)
(Wilson et al. 2021). This measurement only relies on measuring concentrations in
seawater and does not require incubation, a great advantage for making multiple
measurements in almost real time in the ocean. However, since it is an indirect measure (not all H 2 escapes the uptake hydrogenases, and there are other sources and
sinks of H 2 in seawater), the patterns of supersaturation are indicative of N 2 fixation
but are not quantitatively related to rates (Moore et al. 2009, 2018).
Fig. 5.4 NanoSIMS images of the UCYN-A/haptophyte symbiosis after incubation with
15
N 2 gas
and
13 C-bicarbonate. (a) Secondary electron image. (b) Uptake of
15 N via N 2 fixation by the
UCYN-A symbiont (
15
N natural abundance ~0.36 atom%). (c) Uptake of
13 C via carbon fixation by
the haptophyte host (
13
C natural abundance ~1.03 atom%). Arrows point to UCYN-A (bottom) and
the two haptophyte chloroplasts (top). (Images courtesy M.R. Gradoville)
5 Measurements of Organism Abundances and Activities