

147
where [NO 3
−
] is the concentration of NO 3
−
at some point (typically in sub-euphotic
zone waters) and [PO 4
−3
] is the corresponding concentration of PO 4
−3
. A positive N*
indicates a situation in which NO 3
−
concentrations are in excess with respect to
PO 4
−3
relative to that predicted by the Redfield ratio of 16:1. Negative N* values
represent a deficit of NO 3
−
relative to PO 4
−3
. N* gradients are generally considered
along surfaces of constant density or isopycnals along which subsurface waters
flow. N* along these gradients can be integrated across large ocean areas, and trends
in net production or removal used to estimate integrated oceanic rates of N 2 fixation
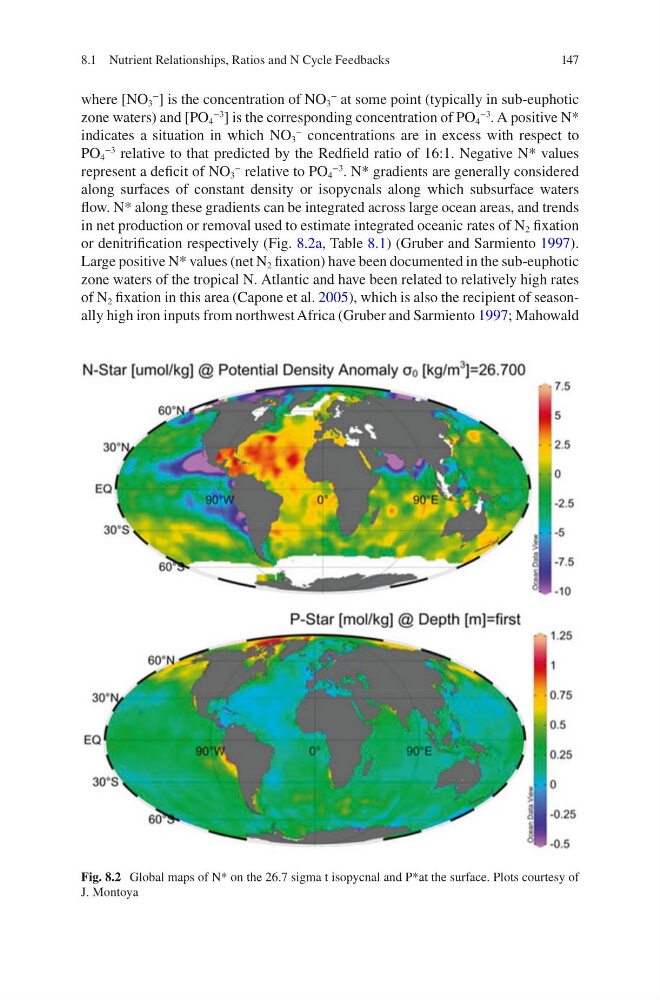
or denitrification respectively (Fig. 8.2a, Table 8.1) (Gruber and Sarmiento 1997).
Large positive N* values (net N 2 fixation) have been documented in the sub- euphotic
zone waters of the tropical N. Atlantic and have been related to relatively high rates
of N 2 fixation in this area (Capone et al. 2005), which is also the recipient of seasonally high iron inputs from northwest Africa (Gruber and Sarmiento 1997; Mahowald
Fig. 8.2 Global maps of N* on the 26.7 sigma t isopycnal and P*at the surface. Plots courtesy of
J. Montoya
8.1 Nutrient Relationships, Ratios and N Cycle Feedbacks
where [NO 3
−
] is the concentration of NO 3
−
at some point (typically in sub-euphotic
zone waters) and [PO 4
−3
] is the corresponding concentration of PO 4
−3
. A positive N*
indicates a situation in which NO 3
−
concentrations are in excess with respect to
PO 4
−3
relative to that predicted by the Redfield ratio of 16:1. Negative N* values
represent a deficit of NO 3
−
relative to PO 4
−3
. N* gradients are generally considered
along surfaces of constant density or isopycnals along which subsurface waters
flow. N* along these gradients can be integrated across large ocean areas, and trends
in net production or removal used to estimate integrated oceanic rates of N 2 fixation
or denitrification respectively (Fig. 8.2a, Table 8.1) (Gruber and Sarmiento 1997).
Large positive N* values (net N 2 fixation) have been documented in the sub- euphotic
zone waters of the tropical N. Atlantic and have been related to relatively high rates
of N 2 fixation in this area (Capone et al. 2005), which is also the recipient of seasonally high iron inputs from northwest Africa (Gruber and Sarmiento 1997; Mahowald
Fig. 8.2 Global maps of N* on the 26.7 sigma t isopycnal and P*at the surface. Plots courtesy of
J. Montoya
8.1 Nutrient Relationships, Ratios and N Cycle Feedbacks