

146
8.1 Nutrient Relationships, Ratios and N Cycle Feedbacks
The proportions of key nutrients in planktonic biological materials in the sea (e.g.
C:N:P of 106:16:1) is often referred to as the Redfield Ratio as Redfield (1958)
noted that the N:P ratio of NO 3
−
and PO 4
−3
in deeper ocean waters closely reflected
the same ratio in plankton biomass (see Chap. 5). Indeed, this deepwater ratio of
NO 3
−
and PO 4
−3
had been long assumed to be relatively constant throughout the
oceans (Michaels et al. 2001), directly reflecting the inorganic products of degradation of organic matter which had sunk into the deep sea. One consequence of an
imbalance in the inputs and removal pathways of the N cycle, whether local, at the
basin or global scale would be reflected in deviations in ratios of bioavailable N
relative to other key nutrients that would constrain biological productivity.
Stable Isotope Inferences
Stable isotope mass balances at the regional and global scale have also been used to
estimate N 2 fixation rates. Deep water NO 3
−
has an isotopic δ
15
N signature of about
5‰ relative to air N 2 indicating a higher proportion of the heavy isotope,
15
N, in that
pool. As described in Chap. 5, organisms dependent on NO 3
−
tend to have biomass
somewhat enriched in
15
N (and therefore termed “heavy”). At each trophic step in a
food web, there is a progressive enrichment in the
15
N in the resulting organic biomass as enzymes metabolizing organic N discriminate against the heavy isotope
(Montoya 2008) (see Chap. 5). N 2 fixation causes minimal isotopic fractionation
thereby imparting a unique “lighter” signature on the biomass of diazotrophs.
Zooplankton in the North Atlantic basin show clear trends in their biomass
15
N
enrichment with forms on the eastern side of the basin more enriched with
15
N and
those on the western side much lighter, indicating a greater input of N 2 fixation
(Montoya et al. 2002).
The N* Parameter and N 2 Fixation
Extensive major oceanographic surveys starting in the 1970s until the present (e.g.
GEOSECS, WOCE, CLIVAR) have shown that nutrient regeneration ratios in the
ocean range widely, reflecting regional imbalances caused by spatial differences in
N 2 fixation inputs and removal processes (Gruber 2008). Observed inorganic N:P
remineralization ratios are often expressed as N*, a linear mathematical expression
of Redfield regeneration stoichiometry (see also Chap. 5).
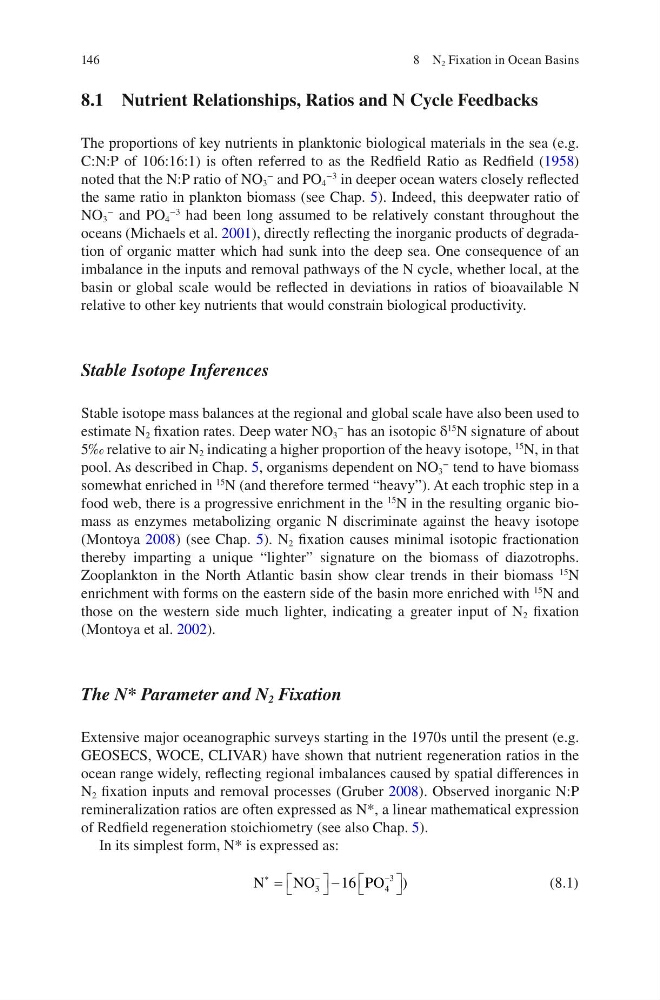
In its simplest form, N* is expressed as:
N
NO
P O
*
-
-
= é ë
ù û - é ë
ù û
3
4
3
16
)
(8.1)
8 N 2 Fixation in Ocean Basins
8.1 Nutrient Relationships, Ratios and N Cycle Feedbacks
The proportions of key nutrients in planktonic biological materials in the sea (e.g.
C:N:P of 106:16:1) is often referred to as the Redfield Ratio as Redfield (1958)
noted that the N:P ratio of NO 3
−
and PO 4
−3
in deeper ocean waters closely reflected
the same ratio in plankton biomass (see Chap. 5). Indeed, this deepwater ratio of
NO 3
−
and PO 4
−3
had been long assumed to be relatively constant throughout the
oceans (Michaels et al. 2001), directly reflecting the inorganic products of degradation of organic matter which had sunk into the deep sea. One consequence of an
imbalance in the inputs and removal pathways of the N cycle, whether local, at the
basin or global scale would be reflected in deviations in ratios of bioavailable N
relative to other key nutrients that would constrain biological productivity.
Stable Isotope Inferences
Stable isotope mass balances at the regional and global scale have also been used to
estimate N 2 fixation rates. Deep water NO 3
−
has an isotopic δ
15
N signature of about
5‰ relative to air N 2 indicating a higher proportion of the heavy isotope,
15
N, in that
pool. As described in Chap. 5, organisms dependent on NO 3
−
tend to have biomass
somewhat enriched in
15
N (and therefore termed “heavy”). At each trophic step in a
food web, there is a progressive enrichment in the
15
N in the resulting organic biomass as enzymes metabolizing organic N discriminate against the heavy isotope
(Montoya 2008) (see Chap. 5). N 2 fixation causes minimal isotopic fractionation
thereby imparting a unique “lighter” signature on the biomass of diazotrophs.
Zooplankton in the North Atlantic basin show clear trends in their biomass
15
N
enrichment with forms on the eastern side of the basin more enriched with
15
N and
those on the western side much lighter, indicating a greater input of N 2 fixation
(Montoya et al. 2002).
The N* Parameter and N 2 Fixation
Extensive major oceanographic surveys starting in the 1970s until the present (e.g.
GEOSECS, WOCE, CLIVAR) have shown that nutrient regeneration ratios in the
ocean range widely, reflecting regional imbalances caused by spatial differences in
N 2 fixation inputs and removal processes (Gruber 2008). Observed inorganic N:P
remineralization ratios are often expressed as N*, a linear mathematical expression
of Redfield regeneration stoichiometry (see also Chap. 5).
In its simplest form, N* is expressed as:
N
NO
P O
*
-
-
= é ë
ù û - é ë
ù û
3
4
3
16
)
(8.1)
8 N 2 Fixation in Ocean Basins