

16. Perform HPLC by injecting 20–50 μL of diluted samples
through the column following the same HPLC operating
procedure (as described previously) to develop a standard
curve for absolute carotenoid quantification.
17. Follow the instruction given in steps 2 and 3 to calculate peak
area and carotenoid abundance.
18. Calculate the slope of the dilution series and use this coefficient to calculate the absolute carotenoid abundance as g/gfw
(see Note 19). Below is an example of a calibration curve for
β-carotene prepared using C30 column chemistry (see Fig. 4).
4 Notes
1. The extraction buffer can be prepared in large volume as stocks
without BHT and stored according to the risk assessments.
BHT should be added fresh prior to performing carotenoid
extraction.
2. It’s recommended to use 2 steel beads (3 mm diameter) for
each 2 mL microcentrifuge tube. This is optimized to grind up
soft plant tissues with the tissue grinder system. It is better to
use a 2 mL rather than a 1.5 mL microtube as it gives more
space for the steel beads to freely rotate and crush the plant
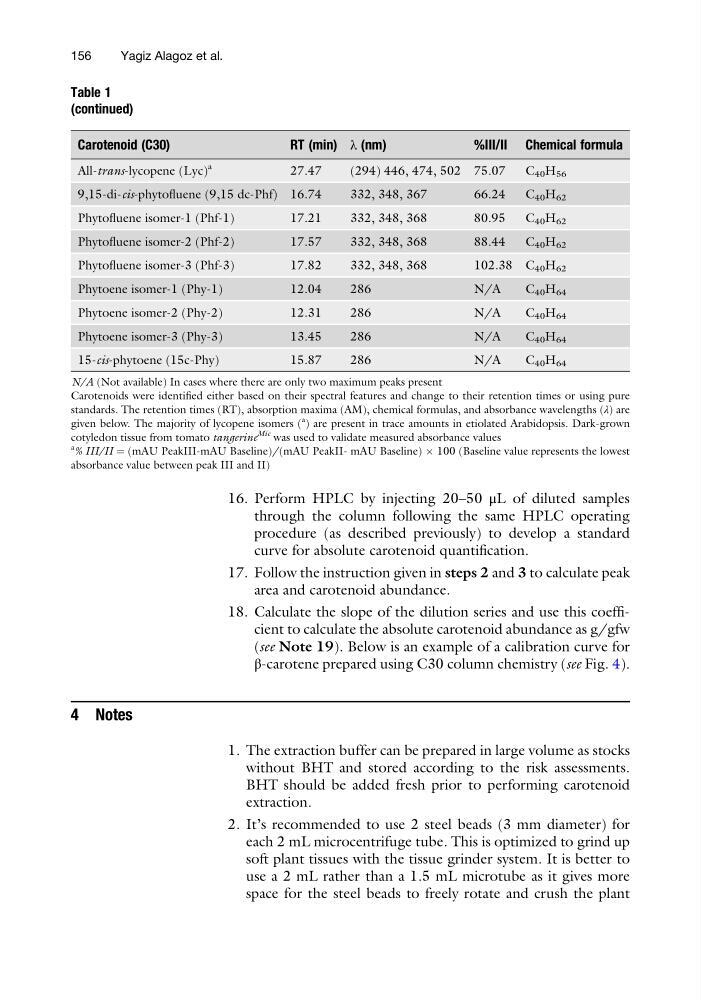
Table 1
(continued)
Carotenoid (C30)
RT (min) λ (nm)
%III/II Chemical formula
All-trans-lycopene (Lyc)
a
27.47
(294) 446, 474, 502 75.07
C 40 H 56
9,15-di-cis-phytofluene (9,15 dc-Phf) 16.74
332, 348, 367
66.24
C 40 H 62
Phytofluene isomer-1 (Phf-1)
17.21
332, 348, 368
80.95
C 40 H 62
Phytofluene isomer-2 (Phf-2)
17.57
332, 348, 368
88.44
C 40 H 62
Phytofluene isomer-3 (Phf-3)
17.82
332, 348, 368
102.38 C 40 H 62
Phytoene isomer-1 (Phy-1)
12.04
286
N/A
C 40 H 64
Phytoene isomer-2 (Phy-2)
12.31
286
N/A
C 40 H 64
Phytoene isomer-3 (Phy-3)
13.45
286
N/A
C 40 H 64
15-cis-phytoene (15c-Phy)
15.87
286
N/A
C 40 H 64
N/A (Not available) In cases where there are only two maximum peaks present
Carotenoids were identified either based on their spectral features and change to their retention times or using pure
standards. The retention times (RT), absorption maxima (AM), chemical formulas, and absorbance wavelengths (λ) are
given below. The majority of lycopene isomers (
a
) are present in trace amounts in etiolated Arabidopsis. Dark-grown
cotyledon tissue from tomato tangerine
Mic was used to validate measured absorbance values
a
% III/II ¼ (mAU PeakIII-mAU Baseline)/(mAU PeakII- mAU Baseline) Â 100 (Baseline value represents the lowest
absorbance value between peak III and II)
156
Yagiz Alagoz et al.
through the column following the same HPLC operating
procedure (as described previously) to develop a standard
curve for absolute carotenoid quantification.
17. Follow the instruction given in steps 2 and 3 to calculate peak
area and carotenoid abundance.
18. Calculate the slope of the dilution series and use this coefficient to calculate the absolute carotenoid abundance as g/gfw
(see Note 19). Below is an example of a calibration curve for
β-carotene prepared using C30 column chemistry (see Fig. 4).
4 Notes
1. The extraction buffer can be prepared in large volume as stocks
without BHT and stored according to the risk assessments.
BHT should be added fresh prior to performing carotenoid
extraction.
2. It’s recommended to use 2 steel beads (3 mm diameter) for
each 2 mL microcentrifuge tube. This is optimized to grind up
soft plant tissues with the tissue grinder system. It is better to
use a 2 mL rather than a 1.5 mL microtube as it gives more
space for the steel beads to freely rotate and crush the plant
Table 1
(continued)
Carotenoid (C30)
RT (min) λ (nm)
%III/II Chemical formula
All-trans-lycopene (Lyc)
a
27.47
(294) 446, 474, 502 75.07
C 40 H 56
9,15-di-cis-phytofluene (9,15 dc-Phf) 16.74
332, 348, 367
66.24
C 40 H 62
Phytofluene isomer-1 (Phf-1)
17.21
332, 348, 368
80.95
C 40 H 62
Phytofluene isomer-2 (Phf-2)
17.57
332, 348, 368
88.44
C 40 H 62
Phytofluene isomer-3 (Phf-3)
17.82
332, 348, 368
102.38 C 40 H 62
Phytoene isomer-1 (Phy-1)
12.04
286
N/A
C 40 H 64
Phytoene isomer-2 (Phy-2)
12.31
286
N/A
C 40 H 64
Phytoene isomer-3 (Phy-3)
13.45
286
N/A
C 40 H 64
15-cis-phytoene (15c-Phy)
15.87
286
N/A
C 40 H 64
N/A (Not available) In cases where there are only two maximum peaks present
Carotenoids were identified either based on their spectral features and change to their retention times or using pure
standards. The retention times (RT), absorption maxima (AM), chemical formulas, and absorbance wavelengths (λ) are
given below. The majority of lycopene isomers (
a
) are present in trace amounts in etiolated Arabidopsis. Dark-grown
cotyledon tissue from tomato tangerine
Mic was used to validate measured absorbance values
a
% III/II ¼ (mAU PeakIII-mAU Baseline)/(mAU PeakII- mAU Baseline) Â 100 (Baseline value represents the lowest
absorbance value between peak III and II)
156
Yagiz Alagoz et al.