

6. Detection is performed at 450 nm, and the online spectra are
acquired in the 330–700 nm wavelength range with a resolution of 1.2 nm.
7. Integrate chromatogram at 450 nm (see Note 26), and record
peak areas for quantification according to calibration curves
prepared with pure carotenoid standards (see Subheading
3.5). As examples, Figs. 1–5 show the HPLC chromatograms
and the online UV/Vis spectra obtained for carotenoid extracts
prepared from spinach leaves, tomato fruits, red pepper fruits,
sarsaparilla berries and egg-yolk, respectively.
8. Calculate concentration from calibration curves (see Note 27)
and give quantitative result in adequate units (i.e., μg/g,
mg/kg, mg/100 g, mg/L, in either fresh or dry weight basis).
3.6 Preparation
of Calibration Curves
1. Prepare a stock solution for each carotenoid standard by dissolving a small amount (300–500 μg) in 5 mL of acetone or
petroleum ether for xanthophylls or carotenes, respectively.
2. Use UV/Vis spectrophotometry for measuring the concentration of the stock solutions by using Beer–Lambert law and the
specific absorption coefficient (A
1%
1cm ) for each carotenoid in a
particular solvent at a characteristic wavelength (λ(nm)). An
appropriate dilution of the stock solution with the selected
solvent is needed. Table 1 presents a list of common carotenoids including specific absorption coefficients, wavelength for
measurement and solvent. Check the literature for a more
detailed list [1, 26, 27].
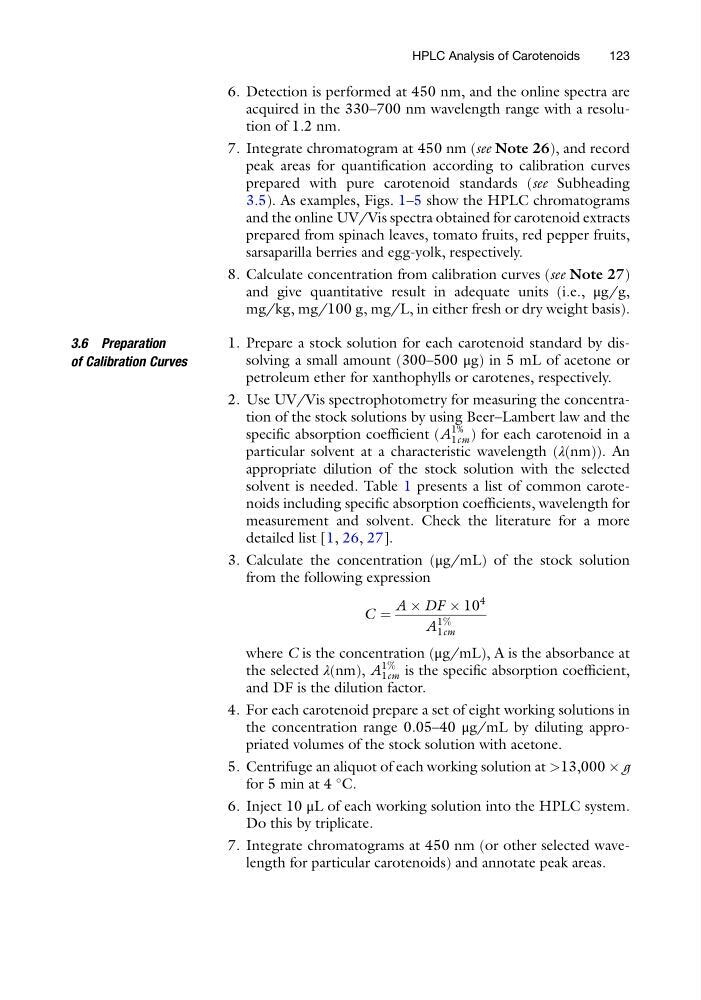
3. Calculate the concentration (μg/mL) of the stock solution
from the following expression
C ¼
A Â DF Â 10
4
A
1%
1cm
where C is the concentration (μg/mL), A is the absorbance at
the selected λ(nm), A
1%
1cm is the specific absorption coefficient,
and DF is the dilution factor.
4. For each carotenoid prepare a set of eight working solutions in
the concentration range 0.05–40 μg/mL by diluting appropriated volumes of the stock solution with acetone.
5. Centrifuge an aliquot of each working solution at >13,000 Â g
for 5 min at 4
C.
6. Inject 10 μL of each working solution into the HPLC system.
Do this by triplicate.
7. Integrate chromatograms at 450 nm (or other selected wavelength for particular carotenoids) and annotate peak areas.
HPLC Analysis of Carotenoids
123
acquired in the 330–700 nm wavelength range with a resolution of 1.2 nm.
7. Integrate chromatogram at 450 nm (see Note 26), and record
peak areas for quantification according to calibration curves
prepared with pure carotenoid standards (see Subheading
3.5). As examples, Figs. 1–5 show the HPLC chromatograms
and the online UV/Vis spectra obtained for carotenoid extracts
prepared from spinach leaves, tomato fruits, red pepper fruits,
sarsaparilla berries and egg-yolk, respectively.
8. Calculate concentration from calibration curves (see Note 27)
and give quantitative result in adequate units (i.e., μg/g,
mg/kg, mg/100 g, mg/L, in either fresh or dry weight basis).
3.6 Preparation
of Calibration Curves
1. Prepare a stock solution for each carotenoid standard by dissolving a small amount (300–500 μg) in 5 mL of acetone or
petroleum ether for xanthophylls or carotenes, respectively.
2. Use UV/Vis spectrophotometry for measuring the concentration of the stock solutions by using Beer–Lambert law and the
specific absorption coefficient (A
1%
1cm ) for each carotenoid in a
particular solvent at a characteristic wavelength (λ(nm)). An
appropriate dilution of the stock solution with the selected
solvent is needed. Table 1 presents a list of common carotenoids including specific absorption coefficients, wavelength for
measurement and solvent. Check the literature for a more
detailed list [1, 26, 27].
3. Calculate the concentration (μg/mL) of the stock solution
from the following expression
C ¼
A Â DF Â 10
4
A
1%
1cm
where C is the concentration (μg/mL), A is the absorbance at
the selected λ(nm), A
1%
1cm is the specific absorption coefficient,
and DF is the dilution factor.
4. For each carotenoid prepare a set of eight working solutions in
the concentration range 0.05–40 μg/mL by diluting appropriated volumes of the stock solution with acetone.
5. Centrifuge an aliquot of each working solution at >13,000 Â g
for 5 min at 4
C.
6. Inject 10 μL of each working solution into the HPLC system.
Do this by triplicate.
7. Integrate chromatograms at 450 nm (or other selected wavelength for particular carotenoids) and annotate peak areas.
HPLC Analysis of Carotenoids
123