

64
T. B. Asafa et al.
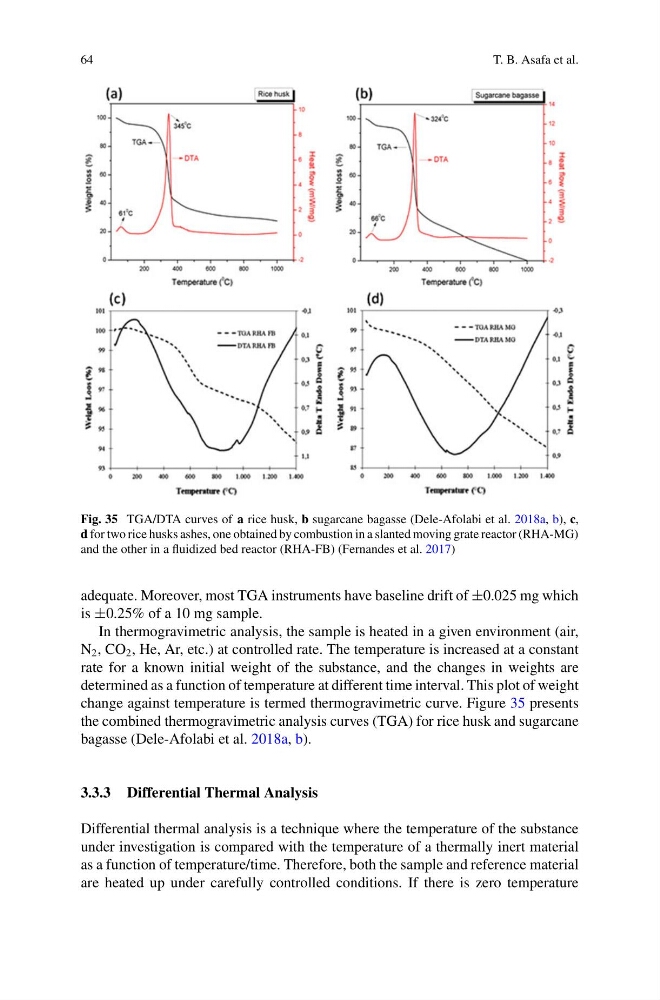
Fig. 35 TGA/DTA curves of a rice husk, b sugarcane bagasse (Dele-Afolabi et al. 2018a, b), c,
d for two rice husks ashes, one obtained by combustion in a slanted moving grate reactor (RHA-MG)
and the other in a fluidized bed reactor (RHA-FB) (Fernandes et al. 2017)
adequate. Moreover, most TGA instruments have baseline drift of ±0.025 mg which
is ±0.25% of a 10 mg sample.
In thermogravimetric analysis, the sample is heated in a given environment (air,
N 2 , CO 2 , He, Ar, etc.) at controlled rate. The temperature is increased at a constant
rate for a known initial weight of the substance, and the changes in weights are
determined as a function of temperature at different time interval. This plot of weight
change against temperature is termed thermogravimetric curve. Figure 35 presents
the combined thermogravimetric analysis curves (TGA) for rice husk and sugarcane
bagasse (Dele-Afolabi et al. 2018a, b).
3.3.3 Differential Thermal Analysis
Differential thermal analysis is a technique where the temperature of the substance
under investigation is compared with the temperature of a thermally inert material
as a function of temperature/time. Therefore, both the sample and reference material
are heated up under carefully controlled conditions. If there is zero temperature
T. B. Asafa et al.
Fig. 35 TGA/DTA curves of a rice husk, b sugarcane bagasse (Dele-Afolabi et al. 2018a, b), c,
d for two rice husks ashes, one obtained by combustion in a slanted moving grate reactor (RHA-MG)
and the other in a fluidized bed reactor (RHA-FB) (Fernandes et al. 2017)
adequate. Moreover, most TGA instruments have baseline drift of ±0.025 mg which
is ±0.25% of a 10 mg sample.
In thermogravimetric analysis, the sample is heated in a given environment (air,
N 2 , CO 2 , He, Ar, etc.) at controlled rate. The temperature is increased at a constant
rate for a known initial weight of the substance, and the changes in weights are
determined as a function of temperature at different time interval. This plot of weight
change against temperature is termed thermogravimetric curve. Figure 35 presents
the combined thermogravimetric analysis curves (TGA) for rice husk and sugarcane
bagasse (Dele-Afolabi et al. 2018a, b).
3.3.3 Differential Thermal Analysis
Differential thermal analysis is a technique where the temperature of the substance
under investigation is compared with the temperature of a thermally inert material
as a function of temperature/time. Therefore, both the sample and reference material
are heated up under carefully controlled conditions. If there is zero temperature