

Characterization Techniques in Nanotechnology …
63
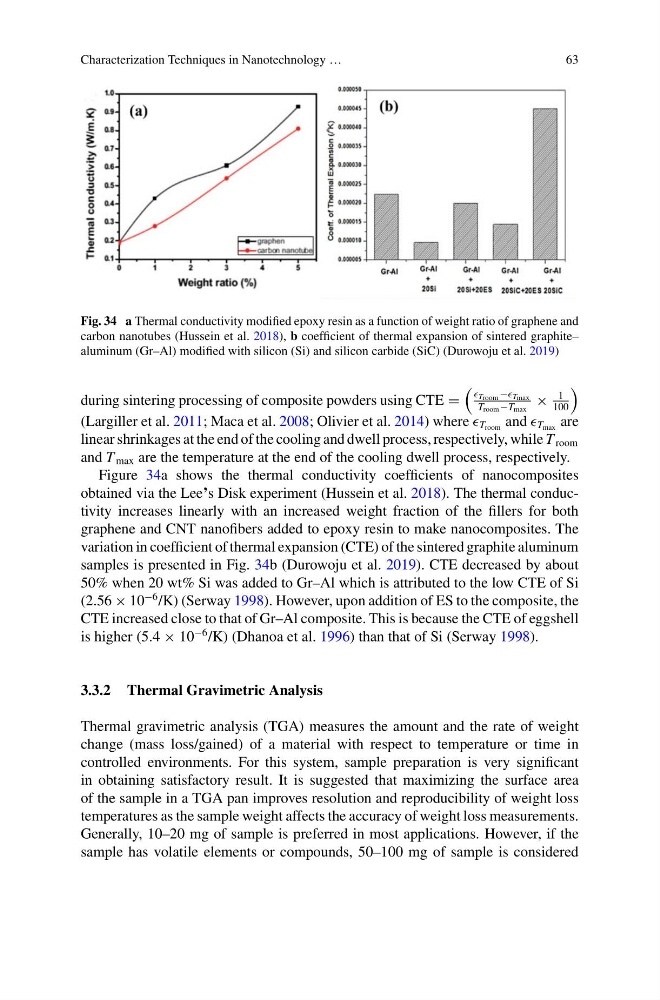
Fig. 34 a Thermal conductivity modified epoxy resin as a function of weight ratio of graphene and
carbon nanotubes (Hussein et al. 2018), b coefficient of thermal expansion of sintered graphite–
aluminum (Gr–Al) modified with silicon (Si) and silicon carbide (SiC) (Durowoju et al. 2019)
during sintering processing of composite powders using CTE =
Troom − Tmax
T room −T max
×
1
100
(Largiller et al. 2011; Maca et al. 2008; Olivier et al. 2014) where T room and T max are
linear shrinkages at the end of the cooling and dwell process, respectively, while T room
and T max are the temperature at the end of the cooling dwell process, respectively.
Figure 34a shows the thermal conductivity coefficients of nanocomposites
obtained via the Lee’s Disk experiment (Hussein et al. 2018). The thermal conductivity increases linearly with an increased weight fraction of the fillers for both
graphene and CNT nanofibers added to epoxy resin to make nanocomposites. The
variation in coefficient of thermal expansion (CTE) of the sintered graphite aluminum
samples is presented in Fig. 34b (Durowoju et al. 2019). CTE decreased by about
50% when 20 wt% Si was added to Gr–Al which is attributed to the low CTE of Si
(2.56 × 10
−6 /K) (Serway 1998). However, upon addition of ES to the composite, the
CTE increased close to that of Gr–Al composite. This is because the CTE of eggshell
is higher (5.4 × 10
−6 /K) (Dhanoa et al. 1996) than that of Si (Serway 1998).
3.3.2 Thermal Gravimetric Analysis
Thermal gravimetric analysis (TGA) measures the amount and the rate of weight
change (mass loss/gained) of a material with respect to temperature or time in
controlled environments. For this system, sample preparation is very significant
in obtaining satisfactory result. It is suggested that maximizing the surface area
of the sample in a TGA pan improves resolution and reproducibility of weight loss
temperatures as the sample weight affects the accuracy of weight loss measurements.
Generally, 10–20 mg of sample is preferred in most applications. However, if the
sample has volatile elements or compounds, 50–100 mg of sample is considered
63
Fig. 34 a Thermal conductivity modified epoxy resin as a function of weight ratio of graphene and
carbon nanotubes (Hussein et al. 2018), b coefficient of thermal expansion of sintered graphite–
aluminum (Gr–Al) modified with silicon (Si) and silicon carbide (SiC) (Durowoju et al. 2019)
during sintering processing of composite powders using CTE =
Troom − Tmax
T room −T max
×
1
100
(Largiller et al. 2011; Maca et al. 2008; Olivier et al. 2014) where T room and T max are
linear shrinkages at the end of the cooling and dwell process, respectively, while T room
and T max are the temperature at the end of the cooling dwell process, respectively.
Figure 34a shows the thermal conductivity coefficients of nanocomposites
obtained via the Lee’s Disk experiment (Hussein et al. 2018). The thermal conductivity increases linearly with an increased weight fraction of the fillers for both
graphene and CNT nanofibers added to epoxy resin to make nanocomposites. The
variation in coefficient of thermal expansion (CTE) of the sintered graphite aluminum
samples is presented in Fig. 34b (Durowoju et al. 2019). CTE decreased by about
50% when 20 wt% Si was added to Gr–Al which is attributed to the low CTE of Si
(2.56 × 10
−6 /K) (Serway 1998). However, upon addition of ES to the composite, the
CTE increased close to that of Gr–Al composite. This is because the CTE of eggshell
is higher (5.4 × 10
−6 /K) (Dhanoa et al. 1996) than that of Si (Serway 1998).
3.3.2 Thermal Gravimetric Analysis
Thermal gravimetric analysis (TGA) measures the amount and the rate of weight
change (mass loss/gained) of a material with respect to temperature or time in
controlled environments. For this system, sample preparation is very significant
in obtaining satisfactory result. It is suggested that maximizing the surface area
of the sample in a TGA pan improves resolution and reproducibility of weight loss
temperatures as the sample weight affects the accuracy of weight loss measurements.
Generally, 10–20 mg of sample is preferred in most applications. However, if the
sample has volatile elements or compounds, 50–100 mg of sample is considered