

Characterization Techniques in Nanotechnology …
25
collated on the basis of measurements of the coherence of a radiative source, using
time-domain or space-domain measurements of the electromagnetic radiation. Thus,
an FTIR spectrometer concurrently collects spectral data in a broad spectral range.
These raw data are then transformed into the actual spectrum via Fourier transformation based on Wiener–Khinchin theorem (Iniewski 2009). The FTIR spectrometer
depends on interferences of different frequencies of light to generate a spectrum.
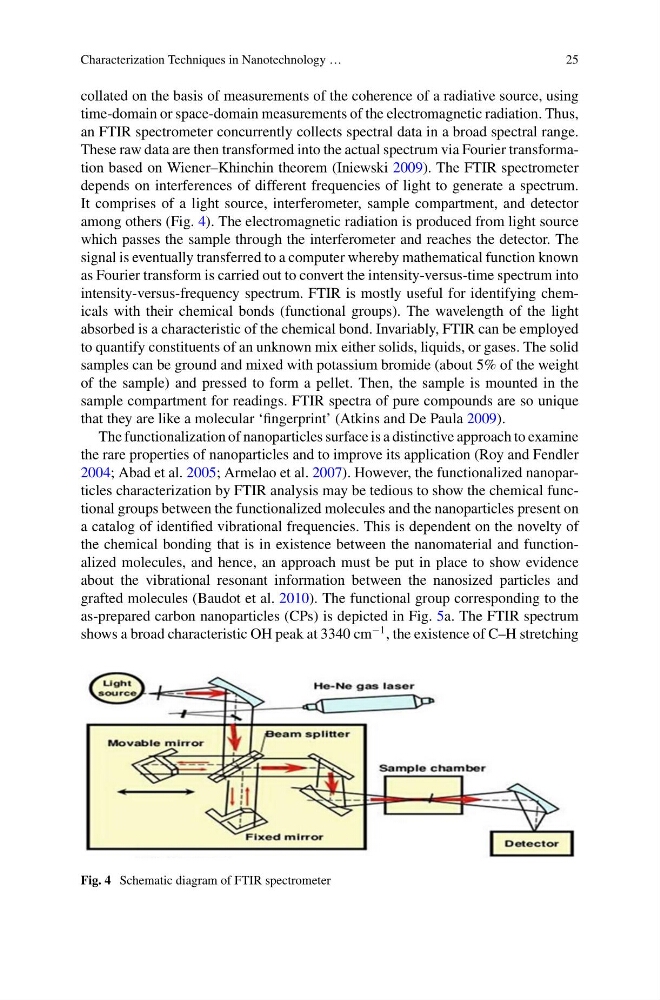
It comprises of a light source, interferometer, sample compartment, and detector
among others (Fig. 4). The electromagnetic radiation is produced from light source
which passes the sample through the interferometer and reaches the detector. The
signal is eventually transferred to a computer whereby mathematical function known
as Fourier transform is carried out to convert the intensity-versus-time spectrum into
intensity-versus-frequency spectrum. FTIR is mostly useful for identifying chemicals with their chemical bonds (functional groups). The wavelength of the light
absorbed is a characteristic of the chemical bond. Invariably, FTIR can be employed
to quantify constituents of an unknown mix either solids, liquids, or gases. The solid
samples can be ground and mixed with potassium bromide (about 5% of the weight
of the sample) and pressed to form a pellet. Then, the sample is mounted in the
sample compartment for readings. FTIR spectra of pure compounds are so unique
that they are like a molecular ‘fingerprint’ (Atkins and De Paula 2009).
The functionalization of nanoparticles surface is a distinctive approach to examine
the rare properties of nanoparticles and to improve its application (Roy and Fendler
2004; Abad et al. 2005; Armelao et al. 2007). However, the functionalized nanoparticles characterization by FTIR analysis may be tedious to show the chemical functional groups between the functionalized molecules and the nanoparticles present on
a catalog of identified vibrational frequencies. This is dependent on the novelty of
the chemical bonding that is in existence between the nanomaterial and functionalized molecules, and hence, an approach must be put in place to show evidence
about the vibrational resonant information between the nanosized particles and
grafted molecules (Baudot et al. 2010). The functional group corresponding to the
as-prepared carbon nanoparticles (CPs) is depicted in Fig. 5a. The FTIR spectrum
shows a broad characteristic OH peak at 3340 cm
−1 , the existence of C–H stretching
Fig. 4 Schematic diagram of FTIR spectrometer
25
collated on the basis of measurements of the coherence of a radiative source, using
time-domain or space-domain measurements of the electromagnetic radiation. Thus,
an FTIR spectrometer concurrently collects spectral data in a broad spectral range.
These raw data are then transformed into the actual spectrum via Fourier transformation based on Wiener–Khinchin theorem (Iniewski 2009). The FTIR spectrometer
depends on interferences of different frequencies of light to generate a spectrum.
It comprises of a light source, interferometer, sample compartment, and detector
among others (Fig. 4). The electromagnetic radiation is produced from light source
which passes the sample through the interferometer and reaches the detector. The
signal is eventually transferred to a computer whereby mathematical function known
as Fourier transform is carried out to convert the intensity-versus-time spectrum into
intensity-versus-frequency spectrum. FTIR is mostly useful for identifying chemicals with their chemical bonds (functional groups). The wavelength of the light
absorbed is a characteristic of the chemical bond. Invariably, FTIR can be employed
to quantify constituents of an unknown mix either solids, liquids, or gases. The solid
samples can be ground and mixed with potassium bromide (about 5% of the weight
of the sample) and pressed to form a pellet. Then, the sample is mounted in the
sample compartment for readings. FTIR spectra of pure compounds are so unique
that they are like a molecular ‘fingerprint’ (Atkins and De Paula 2009).
The functionalization of nanoparticles surface is a distinctive approach to examine
the rare properties of nanoparticles and to improve its application (Roy and Fendler
2004; Abad et al. 2005; Armelao et al. 2007). However, the functionalized nanoparticles characterization by FTIR analysis may be tedious to show the chemical functional groups between the functionalized molecules and the nanoparticles present on
a catalog of identified vibrational frequencies. This is dependent on the novelty of
the chemical bonding that is in existence between the nanomaterial and functionalized molecules, and hence, an approach must be put in place to show evidence
about the vibrational resonant information between the nanosized particles and
grafted molecules (Baudot et al. 2010). The functional group corresponding to the
as-prepared carbon nanoparticles (CPs) is depicted in Fig. 5a. The FTIR spectrum
shows a broad characteristic OH peak at 3340 cm
−1 , the existence of C–H stretching
Fig. 4 Schematic diagram of FTIR spectrometer