

3 Water Resource Availability and Quality …
31
Table 1 Water resources potential in North Africa region
Country
P
(mm)
IRGW
(km3/year)
IRSW
(km3/year)
IRW
(km3/year)
TRW
(km3/year)
ARFW
(m3/cap/year)
Algeria
89
4.49
9.76
11.25
11.67
324.3
Egypt
51
1.3
0.5
1.8
57.3
694.2
Libya
56
0.61
0,2
0.71
0.71
109
Mauritania 92
0.3
0.1
0.4
11.41
3219
Morocco
346
10
22
29
29.1
898.6
Tunisia
207
4.49
3.1
4.19
4.59
433.7
Total
–
18.19
35.66
47.35
114.78
–
P: Average rainfall, IRGW: Internal renewable groundwater, IRSW: Internal renewable surface
water, IRW: Internal renewable water, TRW: Total renewable water, ARFW: Annual renewable
freshwater available m3/capita. Source: FAO (2016); World Bank (2017)
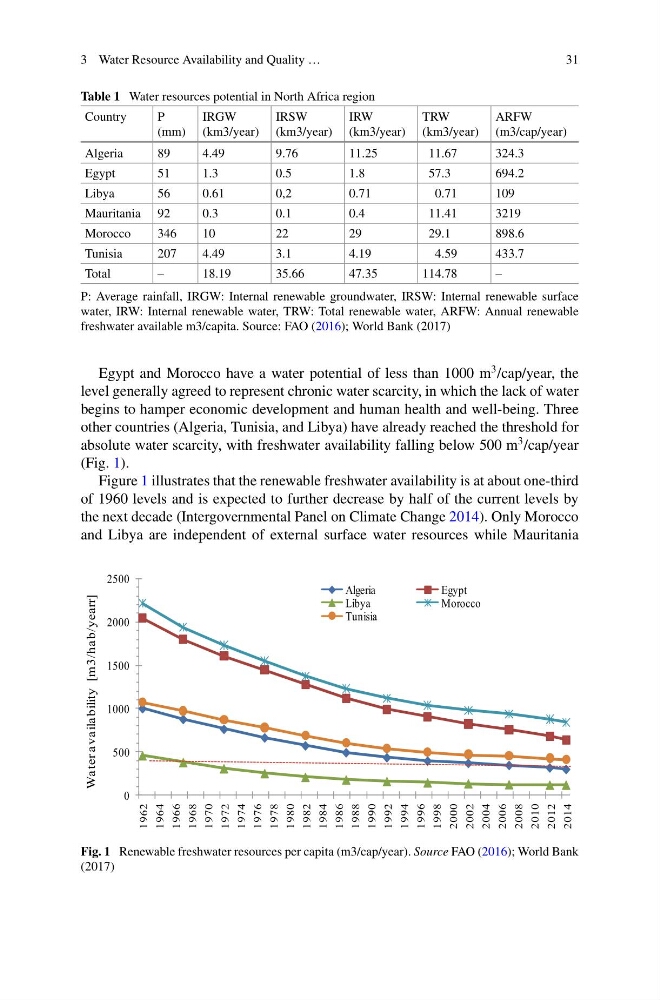
Egypt and Morocco have a water potential of less than 1000 m
3 /cap/year, the
level generally agreed to represent chronic water scarcity, in which the lack of water
begins to hamper economic development and human health and well-being. Three
other countries (Algeria, Tunisia, and Libya) have already reached the threshold for
absolute water scarcity, with freshwater availability falling below 500 m
3 /cap/year
(Fig. 1).
Figure 1 illustrates that the renewable freshwater availability is at about one-third
of 1960 levels and is expected to further decrease by half of the current levels by
the next decade (Intergovernmental Panel on Climate Change 2014). Only Morocco
and Libya are independent of external surface water resources while Mauritania
0
500
1000
1500
2000
2500
1962
1964
1966
1968
1970
1972
1974
1976
1978
1980
1982
1984
1986
1988
1990
1992
1994
1996
1998
2000
2002
2004
2006
2008
2010
2012
2014
Wa ter a va ila bility [m3/ha b/yearr]
Algeria
Egypt
Libya
Morocco
Tunisia
Fig. 1 Renewable freshwater resources per capita (m3/cap/year). Source FAO (2016); World Bank
(2017)
31
Table 1 Water resources potential in North Africa region
Country
P
(mm)
IRGW
(km3/year)
IRSW
(km3/year)
IRW
(km3/year)
TRW
(km3/year)
ARFW
(m3/cap/year)
Algeria
89
4.49
9.76
11.25
11.67
324.3
Egypt
51
1.3
0.5
1.8
57.3
694.2
Libya
56
0.61
0,2
0.71
0.71
109
Mauritania 92
0.3
0.1
0.4
11.41
3219
Morocco
346
10
22
29
29.1
898.6
Tunisia
207
4.49
3.1
4.19
4.59
433.7
Total
–
18.19
35.66
47.35
114.78
–
P: Average rainfall, IRGW: Internal renewable groundwater, IRSW: Internal renewable surface
water, IRW: Internal renewable water, TRW: Total renewable water, ARFW: Annual renewable
freshwater available m3/capita. Source: FAO (2016); World Bank (2017)
Egypt and Morocco have a water potential of less than 1000 m
3 /cap/year, the
level generally agreed to represent chronic water scarcity, in which the lack of water
begins to hamper economic development and human health and well-being. Three
other countries (Algeria, Tunisia, and Libya) have already reached the threshold for
absolute water scarcity, with freshwater availability falling below 500 m
3 /cap/year
(Fig. 1).
Figure 1 illustrates that the renewable freshwater availability is at about one-third
of 1960 levels and is expected to further decrease by half of the current levels by
the next decade (Intergovernmental Panel on Climate Change 2014). Only Morocco
and Libya are independent of external surface water resources while Mauritania
0
500
1000
1500
2000
2500
1962
1964
1966
1968
1970
1972
1974
1976
1978
1980
1982
1984
1986
1988
1990
1992
1994
1996
1998
2000
2002
2004
2006
2008
2010
2012
2014
Wa ter a va ila bility [m3/ha b/yearr]
Algeria
Egypt
Libya
Morocco
Tunisia
Fig. 1 Renewable freshwater resources per capita (m3/cap/year). Source FAO (2016); World Bank
(2017)