

424
T. Mabhaudhi et al.
• It does not capture the financial costs associated with the use of different water
and energy sources.
The WEF Nexus Tool 2.0 represents an opportunity to develop a tool for South
Africa specifically. It may be further improved by including prediction analyses of
population growth, resource demand increase, and financial considerations.
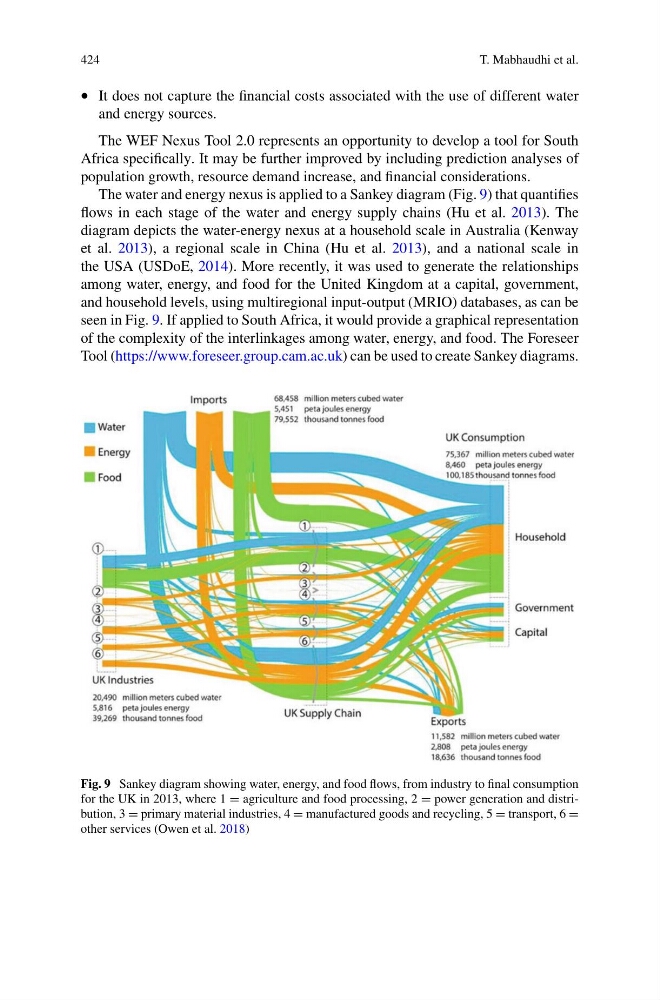
The water and energy nexus is applied to a Sankey diagram (Fig. 9) that quantifies
flows in each stage of the water and energy supply chains (Hu et al. 2013). The
diagram depicts the water-energy nexus at a household scale in Australia (Kenway
et al. 2013), a regional scale in China (Hu et al. 2013), and a national scale in
the USA (USDoE, 2014). More recently, it was used to generate the relationships
among water, energy, and food for the United Kingdom at a capital, government,
and household levels, using multiregional input-output (MRIO) databases, as can be
seen in Fig. 9. If applied to South Africa, it would provide a graphical representation
of the complexity of the interlinkages among water, energy, and food. The Foreseer
Tool (https://www.foreseer.group.cam.ac.uk) can be used to create Sankey diagrams.
Fig. 9 Sankey diagram showing water, energy, and food flows, from industry to final consumption
for the UK in 2013, where 1 = agriculture and food processing, 2 = power generation and distribution, 3 = primary material industries, 4 = manufactured goods and recycling, 5 = transport, 6 =
other services (Owen et al. 2018)
T. Mabhaudhi et al.
• It does not capture the financial costs associated with the use of different water
and energy sources.
The WEF Nexus Tool 2.0 represents an opportunity to develop a tool for South
Africa specifically. It may be further improved by including prediction analyses of
population growth, resource demand increase, and financial considerations.
The water and energy nexus is applied to a Sankey diagram (Fig. 9) that quantifies
flows in each stage of the water and energy supply chains (Hu et al. 2013). The
diagram depicts the water-energy nexus at a household scale in Australia (Kenway
et al. 2013), a regional scale in China (Hu et al. 2013), and a national scale in
the USA (USDoE, 2014). More recently, it was used to generate the relationships
among water, energy, and food for the United Kingdom at a capital, government,
and household levels, using multiregional input-output (MRIO) databases, as can be
seen in Fig. 9. If applied to South Africa, it would provide a graphical representation
of the complexity of the interlinkages among water, energy, and food. The Foreseer
Tool (https://www.foreseer.group.cam.ac.uk) can be used to create Sankey diagrams.
Fig. 9 Sankey diagram showing water, energy, and food flows, from industry to final consumption
for the UK in 2013, where 1 = agriculture and food processing, 2 = power generation and distribution, 3 = primary material industries, 4 = manufactured goods and recycling, 5 = transport, 6 =
other services (Owen et al. 2018)