

16 Potential Transboundary Impacts of the Grand Ethiopian …
379
Operating
after
first
filling
period of 15
BCM and
keeping this
storage as
the
minimum
during
operation
Average
flows for
Blue Nile
in the first
10 years of
filling and
operation
(m 3 / year)
Water level in front of HAD at the
beginning of time series at 160 m
Total
Deficit
Volume
per
country
Water level in front of HAD at the
beginning of time series at 165 m
Total
Deficit
Volume
per
country
Water level in front of HAD at the
beginning of time series at 175 m
Total
Deficit
Volume
per
country
Withdrawals by Egypt and Sudan
Withdrawals by Egypt and Sudan
Withdrawals by Egypt and Sudan
55.5
54
53
52.5
55.5
54
53
52.5
55.5
54
53
52.5
18.5
17
16
15.5
18.5
17
16
15.5
18.5
17
16
15.5
Deficiency Volume
(BCM/year/each country)
Deficiency Volume
(BCM/year/each country)
Deficiency Volume
(BCM/year/each country)
Variable
1.5
2.5
3
variable
1.5
2.5
3
variable 1.5
2.5
3
Deficiency Years
Deficiency Years
Deficiency Years
Filling
Period in 10
Years
50
15
1
9
24
45
14
8
20
38
15
4
6
28
Filling
Period in 6
Years
50
15
1
9
24
45
14
8
20
38
15
4
6
28
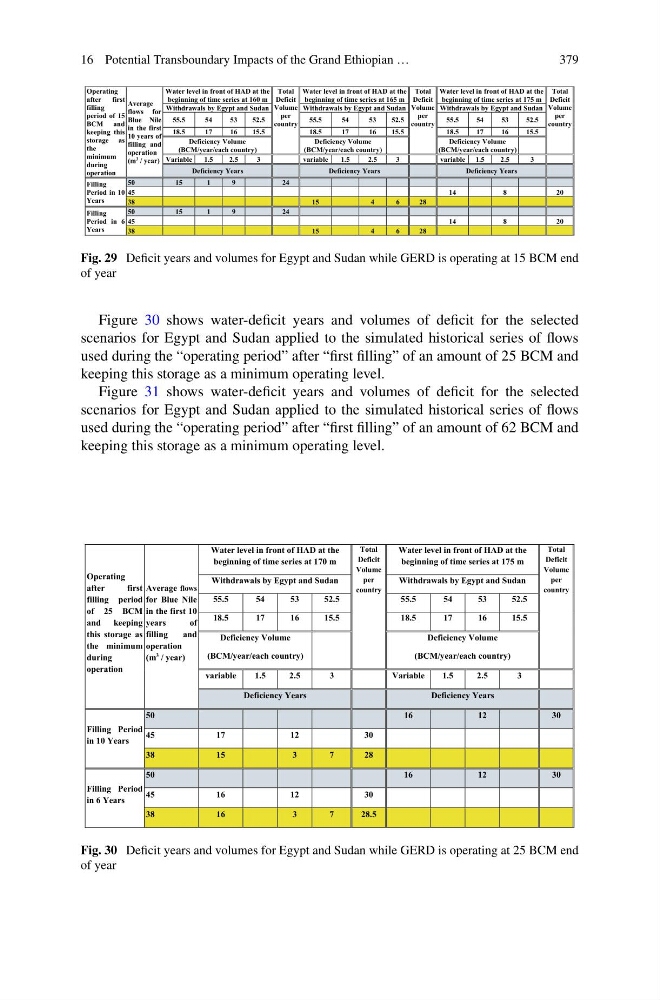
Fig. 29 Deficit years and volumes for Egypt and Sudan while GERD is operating at 15 BCM end
of year
Figure 30 shows water-deficit years and volumes of deficit for the selected
scenarios for Egypt and Sudan applied to the simulated historical series of flows
used during the “operating period” after “first filling” of an amount of 25 BCM and
keeping this storage as a minimum operating level.
Figure 31 shows water-deficit years and volumes of deficit for the selected
scenarios for Egypt and Sudan applied to the simulated historical series of flows
used during the “operating period” after “first filling” of an amount of 62 BCM and
keeping this storage as a minimum operating level.
Operating
after
first
filling period
of 25 BCM
and keeping
this storage as
the minimum
during
operation
Average flows
for Blue Nile
in the first 10
years
of
filling
and
operation
(m
3 / year)
Water level in front of HAD at the
beginning of time series at 170 m
Total
Deficit
Volume
per
country
Water level in front of HAD at the
beginning of time series at 175 m
Total
Deficit
Volume
per
country
Withdrawals by Egypt and Sudan
Withdrawals by Egypt and Sudan
55.5
54
53
52.5
55.5
54
53
52.5
18.5
17
16
15.5
18.5
17
16
15.5
Deficiency Volume
(BCM/year/each country)
Deficiency Volume
(BCM/year/each country)
variable
1.5
2.5
3
Variable
1.5
2.5
3
Deficiency Years
Deficiency Years
Filling Period
in 10 Years
50
16
12
30
45
17
12
30
38
15
3
7
28
Filling Period
in 6 Years
50
16
12
30
45
16
12
30
38
16
3
7
28.5
Fig. 30 Deficit years and volumes for Egypt and Sudan while GERD is operating at 25 BCM end
of year
379
Operating
after
first
filling
period of 15
BCM and
keeping this
storage as
the
minimum
during
operation
Average
flows for
Blue Nile
in the first
10 years of
filling and
operation
(m 3 / year)
Water level in front of HAD at the
beginning of time series at 160 m
Total
Deficit
Volume
per
country
Water level in front of HAD at the
beginning of time series at 165 m
Total
Deficit
Volume
per
country
Water level in front of HAD at the
beginning of time series at 175 m
Total
Deficit
Volume
per
country
Withdrawals by Egypt and Sudan
Withdrawals by Egypt and Sudan
Withdrawals by Egypt and Sudan
55.5
54
53
52.5
55.5
54
53
52.5
55.5
54
53
52.5
18.5
17
16
15.5
18.5
17
16
15.5
18.5
17
16
15.5
Deficiency Volume
(BCM/year/each country)
Deficiency Volume
(BCM/year/each country)
Deficiency Volume
(BCM/year/each country)
Variable
1.5
2.5
3
variable
1.5
2.5
3
variable 1.5
2.5
3
Deficiency Years
Deficiency Years
Deficiency Years
Filling
Period in 10
Years
50
15
1
9
24
45
14
8
20
38
15
4
6
28
Filling
Period in 6
Years
50
15
1
9
24
45
14
8
20
38
15
4
6
28
Fig. 29 Deficit years and volumes for Egypt and Sudan while GERD is operating at 15 BCM end
of year
Figure 30 shows water-deficit years and volumes of deficit for the selected
scenarios for Egypt and Sudan applied to the simulated historical series of flows
used during the “operating period” after “first filling” of an amount of 25 BCM and
keeping this storage as a minimum operating level.
Figure 31 shows water-deficit years and volumes of deficit for the selected
scenarios for Egypt and Sudan applied to the simulated historical series of flows
used during the “operating period” after “first filling” of an amount of 62 BCM and
keeping this storage as a minimum operating level.
Operating
after
first
filling period
of 25 BCM
and keeping
this storage as
the minimum
during
operation
Average flows
for Blue Nile
in the first 10
years
of
filling
and
operation
(m
3 / year)
Water level in front of HAD at the
beginning of time series at 170 m
Total
Deficit
Volume
per
country
Water level in front of HAD at the
beginning of time series at 175 m
Total
Deficit
Volume
per
country
Withdrawals by Egypt and Sudan
Withdrawals by Egypt and Sudan
55.5
54
53
52.5
55.5
54
53
52.5
18.5
17
16
15.5
18.5
17
16
15.5
Deficiency Volume
(BCM/year/each country)
Deficiency Volume
(BCM/year/each country)
variable
1.5
2.5
3
Variable
1.5
2.5
3
Deficiency Years
Deficiency Years
Filling Period
in 10 Years
50
16
12
30
45
17
12
30
38
15
3
7
28
Filling Period
in 6 Years
50
16
12
30
45
16
12
30
38
16
3
7
28.5
Fig. 30 Deficit years and volumes for Egypt and Sudan while GERD is operating at 25 BCM end
of year