

16 Potential Transboundary Impacts of the Grand Ethiopian …
377
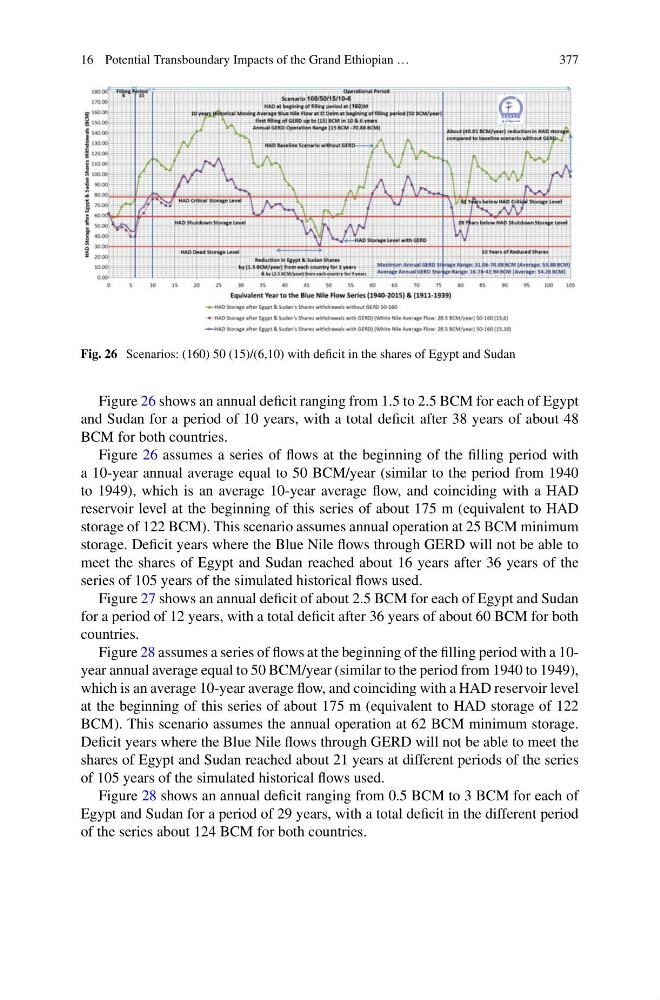
Fig. 26 Scenarios: (160) 50 (15)/(6,10) with deficit in the shares of Egypt and Sudan
Figure 26 shows an annual deficit ranging from 1.5 to 2.5 BCM for each of Egypt
and Sudan for a period of 10 years, with a total deficit after 38 years of about 48
BCM for both countries.
Figure 26 assumes a series of flows at the beginning of the filling period with
a 10-year annual average equal to 50 BCM/year (similar to the period from 1940
to 1949), which is an average 10-year average flow, and coinciding with a HAD
reservoir level at the beginning of this series of about 175 m (equivalent to HAD
storage of 122 BCM). This scenario assumes annual operation at 25 BCM minimum
storage. Deficit years where the Blue Nile flows through GERD will not be able to
meet the shares of Egypt and Sudan reached about 16 years after 36 years of the
series of 105 years of the simulated historical flows used.
Figure 27 shows an annual deficit of about 2.5 BCM for each of Egypt and Sudan
for a period of 12 years, with a total deficit after 36 years of about 60 BCM for both
countries.
Figure 28 assumes a series of flows at the beginning of the filling period with a 10year annual average equal to 50 BCM/year (similar to the period from 1940 to 1949),
which is an average 10-year average flow, and coinciding with a HAD reservoir level
at the beginning of this series of about 175 m (equivalent to HAD storage of 122
BCM). This scenario assumes the annual operation at 62 BCM minimum storage.
Deficit years where the Blue Nile flows through GERD will not be able to meet the
shares of Egypt and Sudan reached about 21 years at different periods of the series
of 105 years of the simulated historical flows used.
Figure 28 shows an annual deficit ranging from 0.5 BCM to 3 BCM for each of
Egypt and Sudan for a period of 29 years, with a total deficit in the different period
of the series about 124 BCM for both countries.
377
Fig. 26 Scenarios: (160) 50 (15)/(6,10) with deficit in the shares of Egypt and Sudan
Figure 26 shows an annual deficit ranging from 1.5 to 2.5 BCM for each of Egypt
and Sudan for a period of 10 years, with a total deficit after 38 years of about 48
BCM for both countries.
Figure 26 assumes a series of flows at the beginning of the filling period with
a 10-year annual average equal to 50 BCM/year (similar to the period from 1940
to 1949), which is an average 10-year average flow, and coinciding with a HAD
reservoir level at the beginning of this series of about 175 m (equivalent to HAD
storage of 122 BCM). This scenario assumes annual operation at 25 BCM minimum
storage. Deficit years where the Blue Nile flows through GERD will not be able to
meet the shares of Egypt and Sudan reached about 16 years after 36 years of the
series of 105 years of the simulated historical flows used.
Figure 27 shows an annual deficit of about 2.5 BCM for each of Egypt and Sudan
for a period of 12 years, with a total deficit after 36 years of about 60 BCM for both
countries.
Figure 28 assumes a series of flows at the beginning of the filling period with a 10year annual average equal to 50 BCM/year (similar to the period from 1940 to 1949),
which is an average 10-year average flow, and coinciding with a HAD reservoir level
at the beginning of this series of about 175 m (equivalent to HAD storage of 122
BCM). This scenario assumes the annual operation at 62 BCM minimum storage.
Deficit years where the Blue Nile flows through GERD will not be able to meet the
shares of Egypt and Sudan reached about 21 years at different periods of the series
of 105 years of the simulated historical flows used.
Figure 28 shows an annual deficit ranging from 0.5 BCM to 3 BCM for each of
Egypt and Sudan for a period of 29 years, with a total deficit in the different period
of the series about 124 BCM for both countries.