

370
K. M. AbuZeid
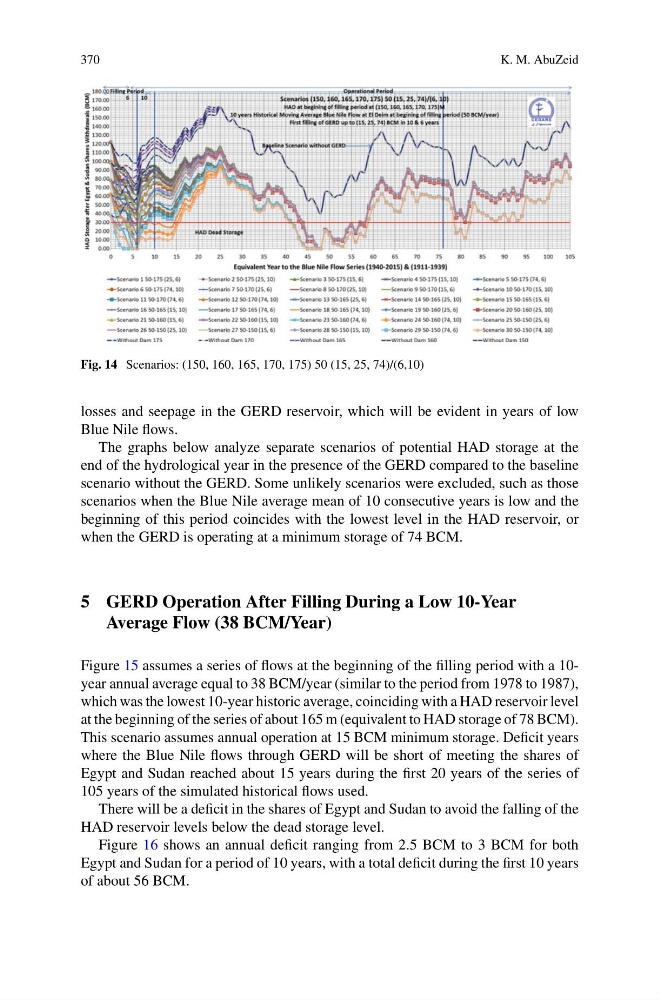
Fig. 14 Scenarios: (150, 160, 165, 170, 175) 50 (15, 25, 74)/(6,10)
losses and seepage in the GERD reservoir, which will be evident in years of low
Blue Nile flows.
The graphs below analyze separate scenarios of potential HAD storage at the
end of the hydrological year in the presence of the GERD compared to the baseline
scenario without the GERD. Some unlikely scenarios were excluded, such as those
scenarios when the Blue Nile average mean of 10 consecutive years is low and the
beginning of this period coincides with the lowest level in the HAD reservoir, or
when the GERD is operating at a minimum storage of 74 BCM.
5 GERD Operation After Filling During a Low 10-Year
Average Flow (38 BCM/Year)
Figure 15 assumes a series of flows at the beginning of the filling period with a 10year annual average equal to 38 BCM/year (similar to the period from 1978 to 1987),
which was the lowest 10-year historic average, coinciding with a HAD reservoir level
at the beginning of the series of about 165 m (equivalent to HAD storage of 78 BCM).
This scenario assumes annual operation at 15 BCM minimum storage. Deficit years
where the Blue Nile flows through GERD will be short of meeting the shares of
Egypt and Sudan reached about 15 years during the first 20 years of the series of
105 years of the simulated historical flows used.
There will be a deficit in the shares of Egypt and Sudan to avoid the falling of the
HAD reservoir levels below the dead storage level.
Figure 16 shows an annual deficit ranging from 2.5 BCM to 3 BCM for both
Egypt and Sudan for a period of 10 years, with a total deficit during the first 10 years
of about 56 BCM.
K. M. AbuZeid
Fig. 14 Scenarios: (150, 160, 165, 170, 175) 50 (15, 25, 74)/(6,10)
losses and seepage in the GERD reservoir, which will be evident in years of low
Blue Nile flows.
The graphs below analyze separate scenarios of potential HAD storage at the
end of the hydrological year in the presence of the GERD compared to the baseline
scenario without the GERD. Some unlikely scenarios were excluded, such as those
scenarios when the Blue Nile average mean of 10 consecutive years is low and the
beginning of this period coincides with the lowest level in the HAD reservoir, or
when the GERD is operating at a minimum storage of 74 BCM.
5 GERD Operation After Filling During a Low 10-Year
Average Flow (38 BCM/Year)
Figure 15 assumes a series of flows at the beginning of the filling period with a 10year annual average equal to 38 BCM/year (similar to the period from 1978 to 1987),
which was the lowest 10-year historic average, coinciding with a HAD reservoir level
at the beginning of the series of about 165 m (equivalent to HAD storage of 78 BCM).
This scenario assumes annual operation at 15 BCM minimum storage. Deficit years
where the Blue Nile flows through GERD will be short of meeting the shares of
Egypt and Sudan reached about 15 years during the first 20 years of the series of
105 years of the simulated historical flows used.
There will be a deficit in the shares of Egypt and Sudan to avoid the falling of the
HAD reservoir levels below the dead storage level.
Figure 16 shows an annual deficit ranging from 2.5 BCM to 3 BCM for both
Egypt and Sudan for a period of 10 years, with a total deficit during the first 10 years
of about 56 BCM.