

368
K. M. AbuZeid
GERD reservoir and the smaller the impact on the flows downstream to Egypt and
Sudan. Thus, the best case scenario is when the GERD reservoir returns to 15 BCM
at a level of about 590 m at the end of the hydrological year. In reality, the level may
need to drop to 7 or 3 BCM in very dry years, however, this was not simulated in
this study. When the level is this low, it is insufficient to operate any of the top 14
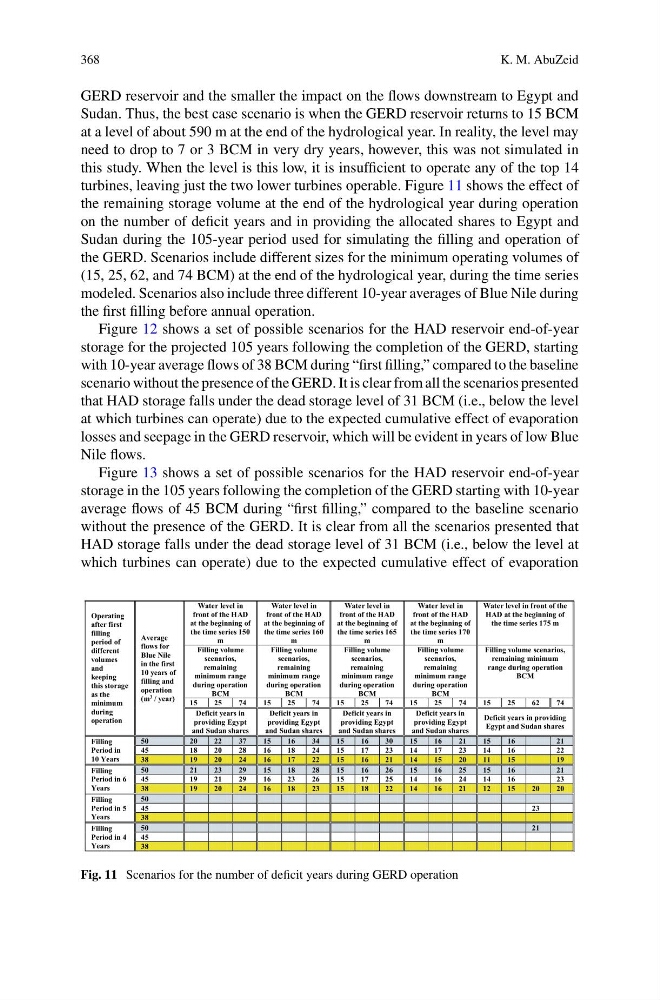
turbines, leaving just the two lower turbines operable. Figure 11 shows the effect of
the remaining storage volume at the end of the hydrological year during operation
on the number of deficit years and in providing the allocated shares to Egypt and
Sudan during the 105-year period used for simulating the filling and operation of
the GERD. Scenarios include different sizes for the minimum operating volumes of
(15, 25, 62, and 74 BCM) at the end of the hydrological year, during the time series
modeled. Scenarios also include three different 10-year averages of Blue Nile during
the first filling before annual operation.
Figure 12 shows a set of possible scenarios for the HAD reservoir end-of-year
storage for the projected 105 years following the completion of the GERD, starting
with 10-year average flows of 38 BCM during “first filling,” compared to the baseline
scenario without the presence of the GERD. It is clear from all the scenarios presented
that HAD storage falls under the dead storage level of 31 BCM (i.e., below the level
at which turbines can operate) due to the expected cumulative effect of evaporation
losses and seepage in the GERD reservoir, which will be evident in years of low Blue
Nile flows.
Figure 13 shows a set of possible scenarios for the HAD reservoir end-of-year
storage in the 105 years following the completion of the GERD starting with 10-year
average flows of 45 BCM during “first filling,” compared to the baseline scenario
without the presence of the GERD. It is clear from all the scenarios presented that
HAD storage falls under the dead storage level of 31 BCM (i.e., below the level at
which turbines can operate) due to the expected cumulative effect of evaporation
Operating
after first
filling
period of
different
volumes
and
keeping
this storage
as the
minimum
during
operation
Average
flows for
Blue Nile
in the first
10 years of
filling and
operation
(m 3 / year)
Water level in
front of the HAD
at the beginning of
the time series 150
m
Water level in
front of the HAD
at the beginning of
the time series 160
m
Water level in
front of the HAD
at the beginning of
the time series 165
m
Water level in
front of the HAD
at the beginning of
the time series 170
m
Water level in front of the
HAD at the beginning of
the time series 175 m
Filling volume
scenarios,
remaining
minimum range
during operation
BCM
Filling volume
scenarios,
remaining
minimum range
during operation
BCM
Filling volume
scenarios,
remaining
minimum range
during operation
BCM
Filling volume
scenarios,
remaining
minimum range
during operation
BCM
Filling volume scenarios,
remaining minimum
range during operation
BCM
15
25
74
15
25
74
15
25
74
15
25
74
15
25
62
74
Deficit years in
providing Egypt
and Sudan shares
Deficit years in
providing Egypt
and Sudan shares
Deficit years in
providing Egypt
and Sudan shares
Deficit years in
providing Egypt
and Sudan shares
Deficit years in providing
Egypt and Sudan shares
Filling
Period in
10 Years
50
20
22
37
15
16
34
15
16
30
15
16
21
15
16
21
45
18
20
28
16
18
24
15
17
23
14
17
23
14
16
22
38
19
20
24
16
17
22
15
16
21
14
15
20
11
15
19
Filling
Period in 6
Years
50
21
23
29
15
18
28
15
16
26
15
16
25
15
16
21
45
19
21
29
16
23
26
15
17
25
14
16
24
14
16
23
38
19
20
24
16
18
23
15
18
22
14
16
21
12
15
20
20
Filling
Period in 5
Years
50
45
23
38
Filling
Period in 4
Years
50
21
45
38
Fig. 11 Scenarios for the number of deficit years during GERD operation
K. M. AbuZeid
GERD reservoir and the smaller the impact on the flows downstream to Egypt and
Sudan. Thus, the best case scenario is when the GERD reservoir returns to 15 BCM
at a level of about 590 m at the end of the hydrological year. In reality, the level may
need to drop to 7 or 3 BCM in very dry years, however, this was not simulated in
this study. When the level is this low, it is insufficient to operate any of the top 14
turbines, leaving just the two lower turbines operable. Figure 11 shows the effect of
the remaining storage volume at the end of the hydrological year during operation
on the number of deficit years and in providing the allocated shares to Egypt and
Sudan during the 105-year period used for simulating the filling and operation of
the GERD. Scenarios include different sizes for the minimum operating volumes of
(15, 25, 62, and 74 BCM) at the end of the hydrological year, during the time series
modeled. Scenarios also include three different 10-year averages of Blue Nile during
the first filling before annual operation.
Figure 12 shows a set of possible scenarios for the HAD reservoir end-of-year
storage for the projected 105 years following the completion of the GERD, starting
with 10-year average flows of 38 BCM during “first filling,” compared to the baseline
scenario without the presence of the GERD. It is clear from all the scenarios presented
that HAD storage falls under the dead storage level of 31 BCM (i.e., below the level
at which turbines can operate) due to the expected cumulative effect of evaporation
losses and seepage in the GERD reservoir, which will be evident in years of low Blue
Nile flows.
Figure 13 shows a set of possible scenarios for the HAD reservoir end-of-year
storage in the 105 years following the completion of the GERD starting with 10-year
average flows of 45 BCM during “first filling,” compared to the baseline scenario
without the presence of the GERD. It is clear from all the scenarios presented that
HAD storage falls under the dead storage level of 31 BCM (i.e., below the level at
which turbines can operate) due to the expected cumulative effect of evaporation
Operating
after first
filling
period of
different
volumes
and
keeping
this storage
as the
minimum
during
operation
Average
flows for
Blue Nile
in the first
10 years of
filling and
operation
(m 3 / year)
Water level in
front of the HAD
at the beginning of
the time series 150
m
Water level in
front of the HAD
at the beginning of
the time series 160
m
Water level in
front of the HAD
at the beginning of
the time series 165
m
Water level in
front of the HAD
at the beginning of
the time series 170
m
Water level in front of the
HAD at the beginning of
the time series 175 m
Filling volume
scenarios,
remaining
minimum range
during operation
BCM
Filling volume
scenarios,
remaining
minimum range
during operation
BCM
Filling volume
scenarios,
remaining
minimum range
during operation
BCM
Filling volume
scenarios,
remaining
minimum range
during operation
BCM
Filling volume scenarios,
remaining minimum
range during operation
BCM
15
25
74
15
25
74
15
25
74
15
25
74
15
25
62
74
Deficit years in
providing Egypt
and Sudan shares
Deficit years in
providing Egypt
and Sudan shares
Deficit years in
providing Egypt
and Sudan shares
Deficit years in
providing Egypt
and Sudan shares
Deficit years in providing
Egypt and Sudan shares
Filling
Period in
10 Years
50
20
22
37
15
16
34
15
16
30
15
16
21
15
16
21
45
18
20
28
16
18
24
15
17
23
14
17
23
14
16
22
38
19
20
24
16
17
22
15
16
21
14
15
20
11
15
19
Filling
Period in 6
Years
50
21
23
29
15
18
28
15
16
26
15
16
25
15
16
21
45
19
21
29
16
23
26
15
17
25
14
16
24
14
16
23
38
19
20
24
16
18
23
15
18
22
14
16
21
12
15
20
20
Filling
Period in 5
Years
50
45
23
38
Filling
Period in 4
Years
50
21
45
38
Fig. 11 Scenarios for the number of deficit years during GERD operation