

296
I. Thiaw et al.
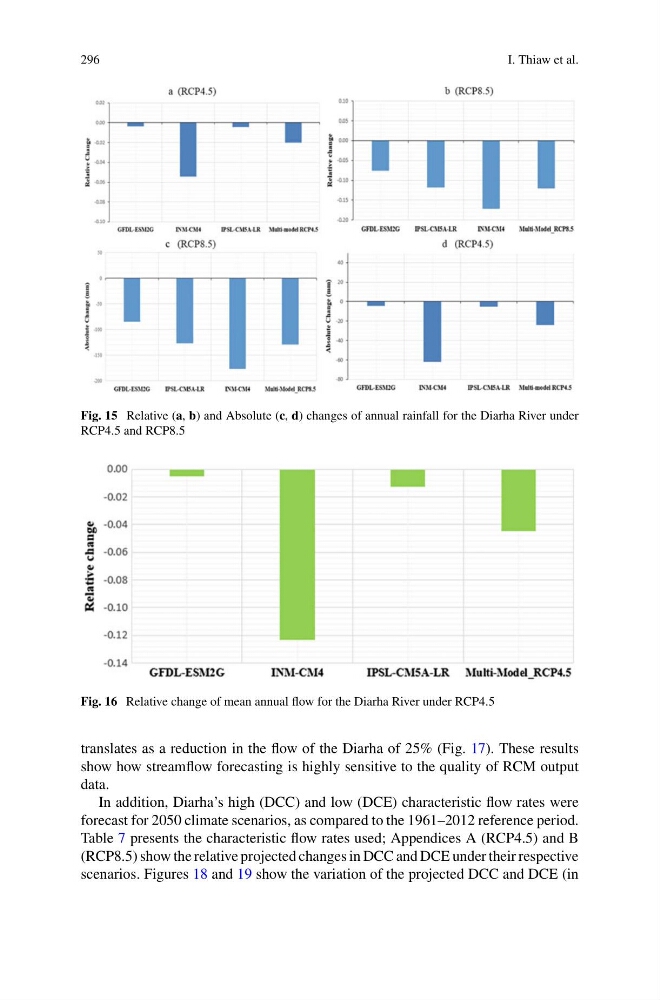
Fig. 15 Relative (a, b) and Absolute (c, d) changes of annual rainfall for the Diarha River under
RCP4.5 and RCP8.5
Fig. 16 Relative change of mean annual flow for the Diarha River under RCP4.5
translates as a reduction in the flow of the Diarha of 25% (Fig. 17). These results
show how streamflow forecasting is highly sensitive to the quality of RCM output
data.
In addition, Diarha’s high (DCC) and low (DCE) characteristic flow rates were
forecast for 2050 climate scenarios, as compared to the 1961–2012 reference period.
Table 7 presents the characteristic flow rates used; Appendices A (RCP4.5) and B
(RCP8.5) show the relative projected changes in DCC and DCE under their respective
scenarios. Figures 18 and 19 show the variation of the projected DCC and DCE (in
I. Thiaw et al.
Fig. 15 Relative (a, b) and Absolute (c, d) changes of annual rainfall for the Diarha River under
RCP4.5 and RCP8.5
Fig. 16 Relative change of mean annual flow for the Diarha River under RCP4.5
translates as a reduction in the flow of the Diarha of 25% (Fig. 17). These results
show how streamflow forecasting is highly sensitive to the quality of RCM output
data.
In addition, Diarha’s high (DCC) and low (DCE) characteristic flow rates were
forecast for 2050 climate scenarios, as compared to the 1961–2012 reference period.
Table 7 presents the characteristic flow rates used; Appendices A (RCP4.5) and B
(RCP8.5) show the relative projected changes in DCC and DCE under their respective
scenarios. Figures 18 and 19 show the variation of the projected DCC and DCE (in