

10 Hydrology and Climate Impacts on Streamflow and Sediment …
231
y = 64.02e -0.036x
R² = 0.898
0
20
40
60
80
100
120
0
20
40
60
80
100
120
Probability (%)
River Discharge (m 3 /s)
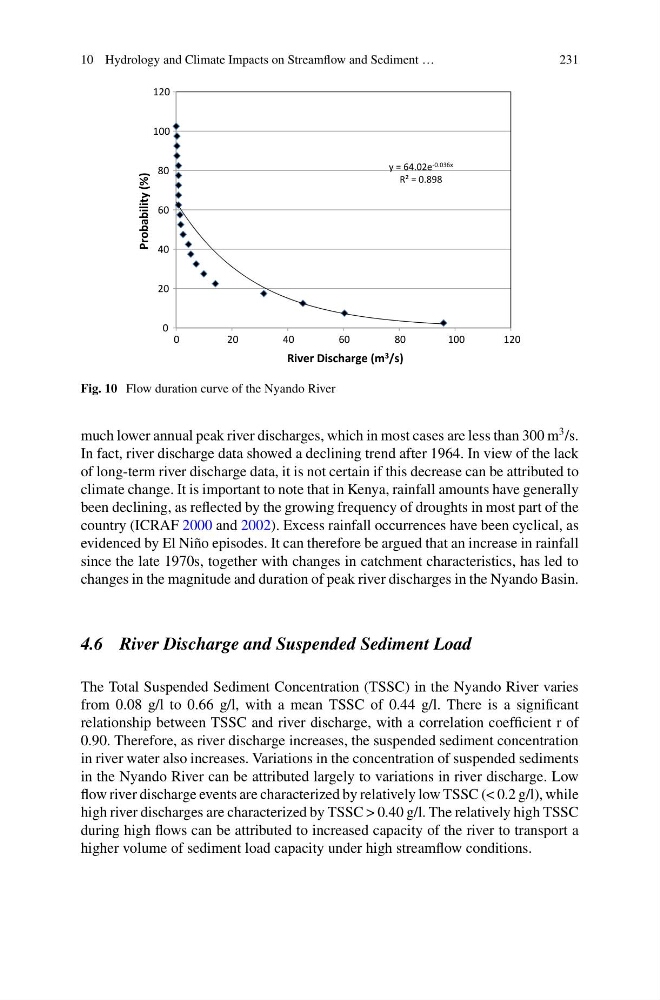
Fig. 10 Flow duration curve of the Nyando River
much lower annual peak river discharges, which in most cases are less than 300 m
3 /s.
In fact, river discharge data showed a declining trend after 1964. In view of the lack
of long-term river discharge data, it is not certain if this decrease can be attributed to
climate change. It is important to note that in Kenya, rainfall amounts have generally
been declining, as reflected by the growing frequency of droughts in most part of the
country (ICRAF 2000 and 2002). Excess rainfall occurrences have been cyclical, as
evidenced by El Niño episodes. It can therefore be argued that an increase in rainfall
since the late 1970s, together with changes in catchment characteristics, has led to
changes in the magnitude and duration of peak river discharges in the Nyando Basin.
4.6 River Discharge and Suspended Sediment Load
The Total Suspended Sediment Concentration (TSSC) in the Nyando River varies
from 0.08 g/l to 0.66 g/l, with a mean TSSC of 0.44 g/l. There is a significant
relationship between TSSC and river discharge, with a correlation coefficient r of
0.90. Therefore, as river discharge increases, the suspended sediment concentration
in river water also increases. Variations in the concentration of suspended sediments
in the Nyando River can be attributed largely to variations in river discharge. Low
flow river discharge events are characterized by relatively low TSSC (< 0.2 g/l), while
high river discharges are characterized by TSSC > 0.40 g/l. The relatively high TSSC
during high flows can be attributed to increased capacity of the river to transport a
higher volume of sediment load capacity under high streamflow conditions.
231
y = 64.02e -0.036x
R² = 0.898
0
20
40
60
80
100
120
0
20
40
60
80
100
120
Probability (%)
River Discharge (m 3 /s)
Fig. 10 Flow duration curve of the Nyando River
much lower annual peak river discharges, which in most cases are less than 300 m
3 /s.
In fact, river discharge data showed a declining trend after 1964. In view of the lack
of long-term river discharge data, it is not certain if this decrease can be attributed to
climate change. It is important to note that in Kenya, rainfall amounts have generally
been declining, as reflected by the growing frequency of droughts in most part of the
country (ICRAF 2000 and 2002). Excess rainfall occurrences have been cyclical, as
evidenced by El Niño episodes. It can therefore be argued that an increase in rainfall
since the late 1970s, together with changes in catchment characteristics, has led to
changes in the magnitude and duration of peak river discharges in the Nyando Basin.
4.6 River Discharge and Suspended Sediment Load
The Total Suspended Sediment Concentration (TSSC) in the Nyando River varies
from 0.08 g/l to 0.66 g/l, with a mean TSSC of 0.44 g/l. There is a significant
relationship between TSSC and river discharge, with a correlation coefficient r of
0.90. Therefore, as river discharge increases, the suspended sediment concentration
in river water also increases. Variations in the concentration of suspended sediments
in the Nyando River can be attributed largely to variations in river discharge. Low
flow river discharge events are characterized by relatively low TSSC (< 0.2 g/l), while
high river discharges are characterized by TSSC > 0.40 g/l. The relatively high TSSC
during high flows can be attributed to increased capacity of the river to transport a
higher volume of sediment load capacity under high streamflow conditions.