

230
J. U. Kitheka et al.
-4
-2
0
2
4
6
8
-30
-20
-10
0
10
20
30
40
50
60
1
5
9
13
17
21
25
29
33
37
41
45
49
53
57
61
65
69
73
77
81
85
89
93
97
Rainfall Deficit (cm)
Discharge Deficit (m 3
/s)
Months
Discharge Deficit
Rainfall Deficit
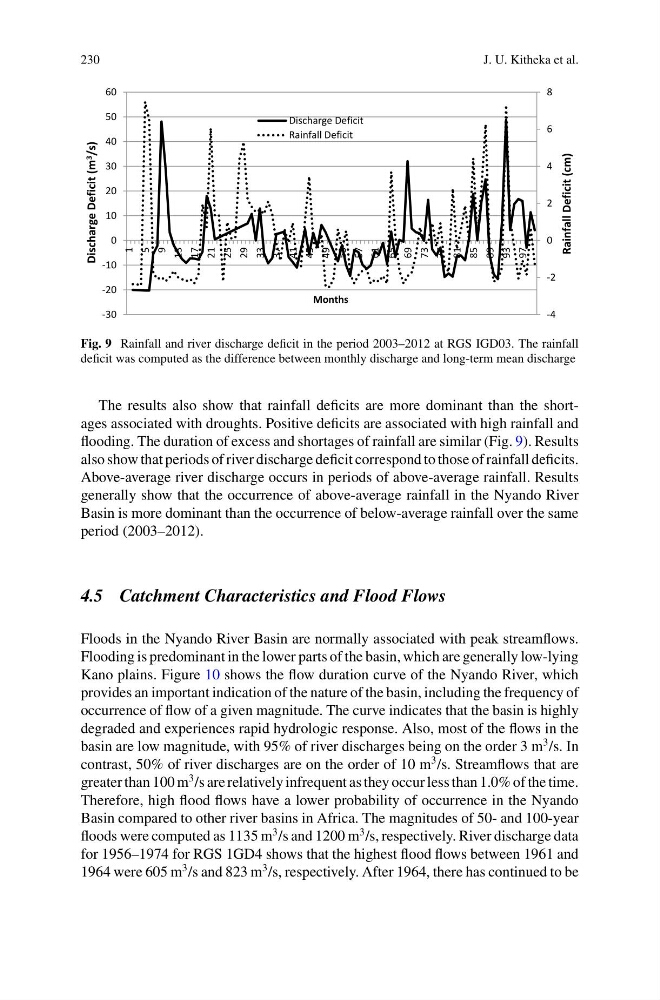
Fig. 9 Rainfall and river discharge deficit in the period 2003–2012 at RGS IGD03. The rainfall
deficit was computed as the difference between monthly discharge and long-term mean discharge
The results also show that rainfall deficits are more dominant than the shortages associated with droughts. Positive deficits are associated with high rainfall and
flooding. The duration of excess and shortages of rainfall are similar (Fig. 9). Results
also show that periods of river discharge deficit correspond to those of rainfall deficits.
Above-average river discharge occurs in periods of above-average rainfall. Results
generally show that the occurrence of above-average rainfall in the Nyando River
Basin is more dominant than the occurrence of below-average rainfall over the same
period (2003–2012).
4.5 Catchment Characteristics and Flood Flows
Floods in the Nyando River Basin are normally associated with peak streamflows.
Flooding is predominant in the lower parts of the basin, which are generally low-lying
Kano plains. Figure 10 shows the flow duration curve of the Nyando River, which
provides an important indication of the nature of the basin, including the frequency of
occurrence of flow of a given magnitude. The curve indicates that the basin is highly
degraded and experiences rapid hydrologic response. Also, most of the flows in the
basin are low magnitude, with 95% of river discharges being on the order 3 m
3 /s. In
contrast, 50% of river discharges are on the order of 10 m
3 /s. Streamflows that are
greater than 100 m
3 /s are relatively infrequent as they occur less than 1.0% of the time.
Therefore, high flood flows have a lower probability of occurrence in the Nyando
Basin compared to other river basins in Africa. The magnitudes of 50- and 100-year
floods were computed as 1135 m
3 /s and 1200 m
3 /s, respectively. River discharge data
for 1956–1974 for RGS 1GD4 shows that the highest flood flows between 1961 and
1964 were 605 m
3 /s and 823 m
3 /s, respectively. After 1964, there has continued to be
J. U. Kitheka et al.
-4
-2
0
2
4
6
8
-30
-20
-10
0
10
20
30
40
50
60
1
5
9
13
17
21
25
29
33
37
41
45
49
53
57
61
65
69
73
77
81
85
89
93
97
Rainfall Deficit (cm)
Discharge Deficit (m 3
/s)
Months
Discharge Deficit
Rainfall Deficit
Fig. 9 Rainfall and river discharge deficit in the period 2003–2012 at RGS IGD03. The rainfall
deficit was computed as the difference between monthly discharge and long-term mean discharge
The results also show that rainfall deficits are more dominant than the shortages associated with droughts. Positive deficits are associated with high rainfall and
flooding. The duration of excess and shortages of rainfall are similar (Fig. 9). Results
also show that periods of river discharge deficit correspond to those of rainfall deficits.
Above-average river discharge occurs in periods of above-average rainfall. Results
generally show that the occurrence of above-average rainfall in the Nyando River
Basin is more dominant than the occurrence of below-average rainfall over the same
period (2003–2012).
4.5 Catchment Characteristics and Flood Flows
Floods in the Nyando River Basin are normally associated with peak streamflows.
Flooding is predominant in the lower parts of the basin, which are generally low-lying
Kano plains. Figure 10 shows the flow duration curve of the Nyando River, which
provides an important indication of the nature of the basin, including the frequency of
occurrence of flow of a given magnitude. The curve indicates that the basin is highly
degraded and experiences rapid hydrologic response. Also, most of the flows in the
basin are low magnitude, with 95% of river discharges being on the order 3 m
3 /s. In
contrast, 50% of river discharges are on the order of 10 m
3 /s. Streamflows that are
greater than 100 m
3 /s are relatively infrequent as they occur less than 1.0% of the time.
Therefore, high flood flows have a lower probability of occurrence in the Nyando
Basin compared to other river basins in Africa. The magnitudes of 50- and 100-year
floods were computed as 1135 m
3 /s and 1200 m
3 /s, respectively. River discharge data
for 1956–1974 for RGS 1GD4 shows that the highest flood flows between 1961 and
1964 were 605 m
3 /s and 823 m
3 /s, respectively. After 1964, there has continued to be