

226
J. U. Kitheka et al.
0
0.5
1
1.5
2
2.5
3
3.5
4
4.5
5
2003 2004 2005 2006 2007 2008 2009 2010 2011 2012
Rainfall (mm)
Year
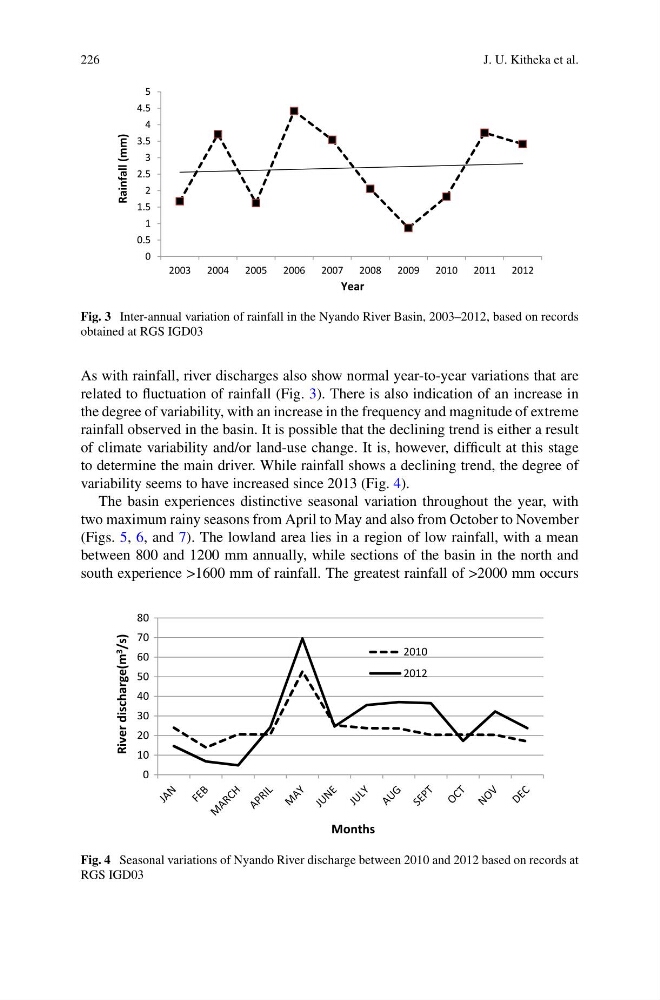
Fig. 3 Inter-annual variation of rainfall in the Nyando River Basin, 2003–2012, based on records
obtained at RGS IGD03
As with rainfall, river discharges also show normal year-to-year variations that are
related to fluctuation of rainfall (Fig. 3). There is also indication of an increase in
the degree of variability, with an increase in the frequency and magnitude of extreme
rainfall observed in the basin. It is possible that the declining trend is either a result
of climate variability and/or land-use change. It is, however, difficult at this stage
to determine the main driver. While rainfall shows a declining trend, the degree of
variability seems to have increased since 2013 (Fig. 4).
The basin experiences distinctive seasonal variation throughout the year, with
two maximum rainy seasons from April to May and also from October to November
(Figs. 5, 6, and 7). The lowland area lies in a region of low rainfall, with a mean
between 800 and 1200 mm annually, while sections of the basin in the north and
south experience >1600 mm of rainfall. The greatest rainfall of >2000 mm occurs
0
10
20
30
40
50
60
70
80
River discharge(m 3
/s)
Months
2010
2012
Fig. 4 Seasonal variations of Nyando River discharge between 2010 and 2012 based on records at
RGS IGD03
J. U. Kitheka et al.
0
0.5
1
1.5
2
2.5
3
3.5
4
4.5
5
2003 2004 2005 2006 2007 2008 2009 2010 2011 2012
Rainfall (mm)
Year
Fig. 3 Inter-annual variation of rainfall in the Nyando River Basin, 2003–2012, based on records
obtained at RGS IGD03
As with rainfall, river discharges also show normal year-to-year variations that are
related to fluctuation of rainfall (Fig. 3). There is also indication of an increase in
the degree of variability, with an increase in the frequency and magnitude of extreme
rainfall observed in the basin. It is possible that the declining trend is either a result
of climate variability and/or land-use change. It is, however, difficult at this stage
to determine the main driver. While rainfall shows a declining trend, the degree of
variability seems to have increased since 2013 (Fig. 4).
The basin experiences distinctive seasonal variation throughout the year, with
two maximum rainy seasons from April to May and also from October to November
(Figs. 5, 6, and 7). The lowland area lies in a region of low rainfall, with a mean
between 800 and 1200 mm annually, while sections of the basin in the north and
south experience >1600 mm of rainfall. The greatest rainfall of >2000 mm occurs
0
10
20
30
40
50
60
70
80
River discharge(m 3
/s)
Months
2010
2012
Fig. 4 Seasonal variations of Nyando River discharge between 2010 and 2012 based on records at
RGS IGD03