

10 Hydrology and Climate Impacts on Streamflow and Sediment …
225
4 Results
4.1 Variability of Rainfall
Streams contributing to the streamflow of the Nyando River originate from high
altitude (1700–3000 m asl). These are high rainfall (1200–2400 mm) areas located
in Kericho and Nandi counties (Fig. 1). The river flows through V-shaped valleys in
the upper mountainous region with a channel width of 20 m (NEMA 2004). At the
middle region, the width of the river is about 40 m, but this increases to a channel
width of 50 m further downstream in the low-lying region (WARMA 2004; Kamau
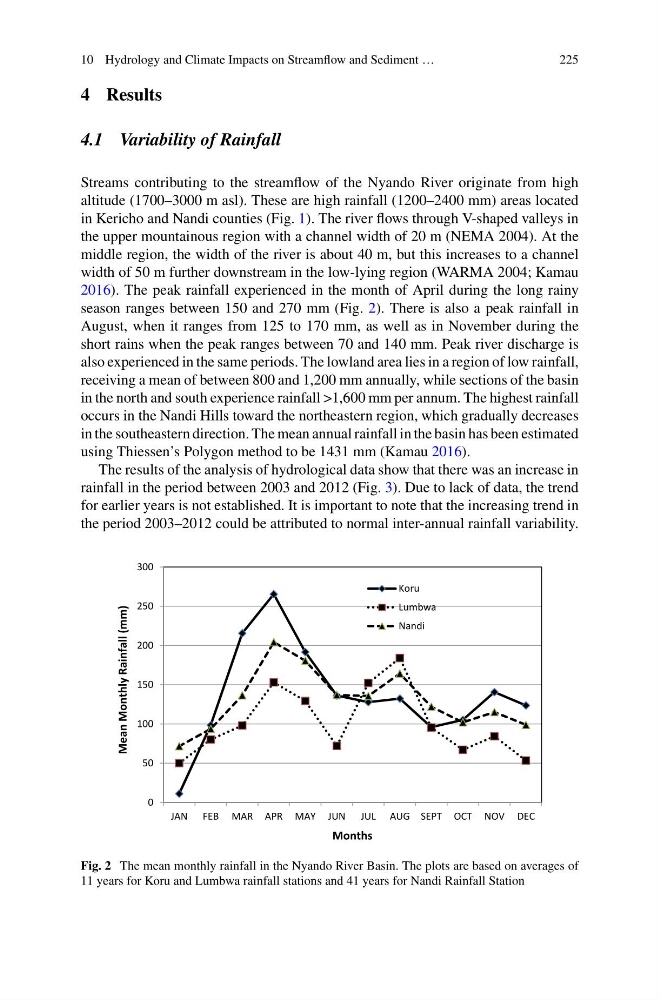
2016). The peak rainfall experienced in the month of April during the long rainy
season ranges between 150 and 270 mm (Fig. 2). There is also a peak rainfall in
August, when it ranges from 125 to 170 mm, as well as in November during the
short rains when the peak ranges between 70 and 140 mm. Peak river discharge is
also experienced in the same periods. The lowland area lies in a region of low rainfall,
receiving a mean of between 800 and 1,200 mm annually, while sections of the basin
in the north and south experience rainfall >1,600 mm per annum. The highest rainfall
occurs in the Nandi Hills toward the northeastern region, which gradually decreases
in the southeastern direction. The mean annual rainfall in the basin has been estimated
using Thiessen’s Polygon method to be 1431 mm (Kamau 2016).
The results of the analysis of hydrological data show that there was an increase in
rainfall in the period between 2003 and 2012 (Fig. 3). Due to lack of data, the trend
for earlier years is not established. It is important to note that the increasing trend in
the period 2003–2012 could be attributed to normal inter-annual rainfall variability.
0
50
100
150
200
250
300
JAN FEB MAR APR MAY JUN JUL AUG SEPT OCT NOV DEC
Mean Monthly Rainfall (mm)
Months
Koru
Lumbwa
Nandi
Fig. 2 The mean monthly rainfall in the Nyando River Basin. The plots are based on averages of
11 years for Koru and Lumbwa rainfall stations and 41 years for Nandi Rainfall Station
225
4 Results
4.1 Variability of Rainfall
Streams contributing to the streamflow of the Nyando River originate from high
altitude (1700–3000 m asl). These are high rainfall (1200–2400 mm) areas located
in Kericho and Nandi counties (Fig. 1). The river flows through V-shaped valleys in
the upper mountainous region with a channel width of 20 m (NEMA 2004). At the
middle region, the width of the river is about 40 m, but this increases to a channel
width of 50 m further downstream in the low-lying region (WARMA 2004; Kamau
2016). The peak rainfall experienced in the month of April during the long rainy
season ranges between 150 and 270 mm (Fig. 2). There is also a peak rainfall in
August, when it ranges from 125 to 170 mm, as well as in November during the
short rains when the peak ranges between 70 and 140 mm. Peak river discharge is
also experienced in the same periods. The lowland area lies in a region of low rainfall,
receiving a mean of between 800 and 1,200 mm annually, while sections of the basin
in the north and south experience rainfall >1,600 mm per annum. The highest rainfall
occurs in the Nandi Hills toward the northeastern region, which gradually decreases
in the southeastern direction. The mean annual rainfall in the basin has been estimated
using Thiessen’s Polygon method to be 1431 mm (Kamau 2016).
The results of the analysis of hydrological data show that there was an increase in
rainfall in the period between 2003 and 2012 (Fig. 3). Due to lack of data, the trend
for earlier years is not established. It is important to note that the increasing trend in
the period 2003–2012 could be attributed to normal inter-annual rainfall variability.
0
50
100
150
200
250
300
JAN FEB MAR APR MAY JUN JUL AUG SEPT OCT NOV DEC
Mean Monthly Rainfall (mm)
Months
Koru
Lumbwa
Nandi
Fig. 2 The mean monthly rainfall in the Nyando River Basin. The plots are based on averages of
11 years for Koru and Lumbwa rainfall stations and 41 years for Nandi Rainfall Station