

448
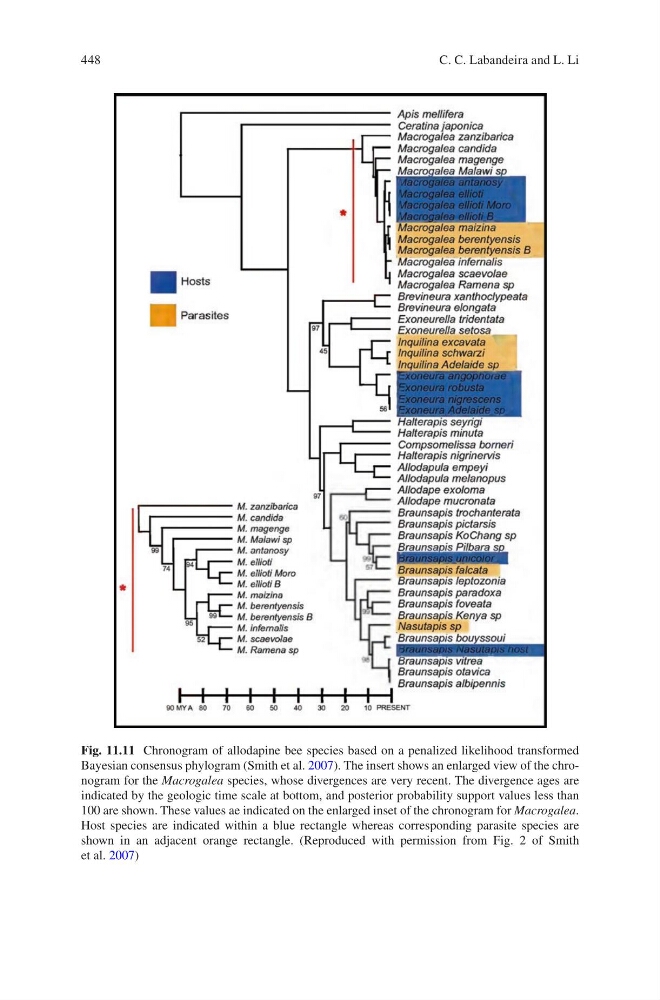
Fig. 11.11 Chronogram of allodapine bee species based on a penalized likelihood transformed
Bayesian consensus phylogram (Smith et al. 2007). The insert shows an enlarged view of the chronogram for the Macrogalea species, whose divergences are very recent. The divergence ages are
indicated by the geologic time scale at bottom, and posterior probability support values less than
100 are shown. These values ae indicated on the enlarged inset of the chronogram for Macrogalea.
Host species are indicated within a blue rectangle whereas corresponding parasite species are
shown in an adjacent orange rectangle. (Reproduced with permission from Fig. 2 of Smith
et al. 2007)
C. C. Labandeira and L. Li
Fig. 11.11 Chronogram of allodapine bee species based on a penalized likelihood transformed
Bayesian consensus phylogram (Smith et al. 2007). The insert shows an enlarged view of the chronogram for the Macrogalea species, whose divergences are very recent. The divergence ages are
indicated by the geologic time scale at bottom, and posterior probability support values less than
100 are shown. These values ae indicated on the enlarged inset of the chronogram for Macrogalea.
Host species are indicated within a blue rectangle whereas corresponding parasite species are
shown in an adjacent orange rectangle. (Reproduced with permission from Fig. 2 of Smith
et al. 2007)
C. C. Labandeira and L. Li