

46
S. F. Ali and D. Rakshit
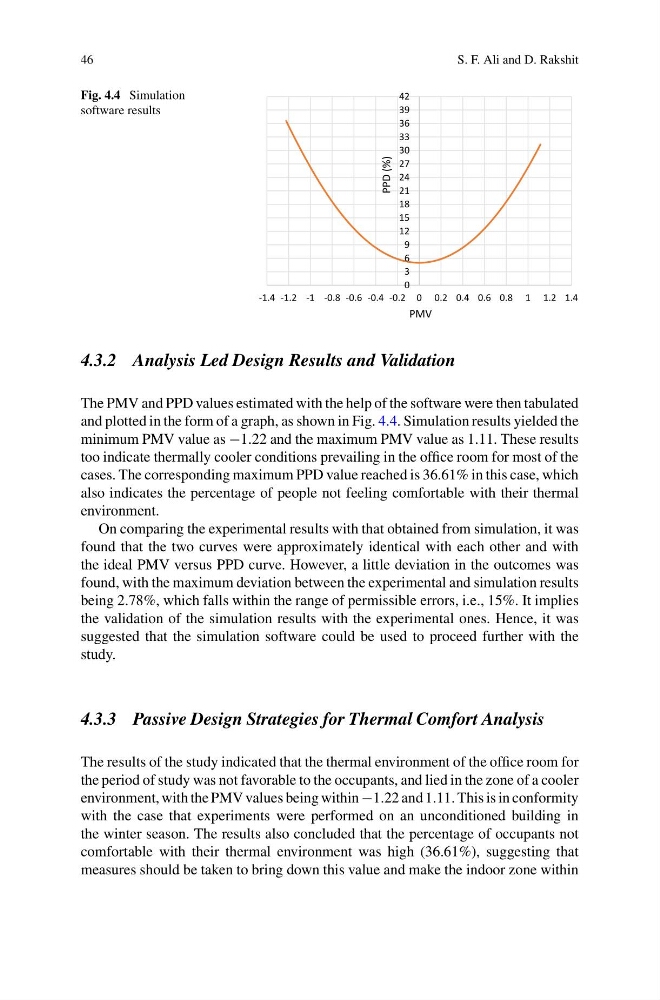
Fig. 4.4 Simulation
software results
0
3
6
9
12
15
18
21
24
27
30
33
36
39
42
-1.4 -1.2 -1 -0.8 -0.6 -0.4 -0.2 0 0.2 0.4 0.6 0.8 1 1.2 1.4
PPD (%)
PMV
4.3.2 Analysis Led Design Results and Validation
The PMV and PPD values estimated with the help of the software were then tabulated
and plotted in the form of a graph, as shown in Fig. 4.4. Simulation results yielded the
minimum PMV value as −1.22 and the maximum PMV value as 1.11. These results
too indicate thermally cooler conditions prevailing in the office room for most of the
cases. The corresponding maximum PPD value reached is 36.61% in this case, which
also indicates the percentage of people not feeling comfortable with their thermal
environment.
On comparing the experimental results with that obtained from simulation, it was
found that the two curves were approximately identical with each other and with
the ideal PMV versus PPD curve. However, a little deviation in the outcomes was
found, with the maximum deviation between the experimental and simulation results
being 2.78%, which falls within the range of permissible errors, i.e., 15%. It implies
the validation of the simulation results with the experimental ones. Hence, it was
suggested that the simulation software could be used to proceed further with the
study.
4.3.3 Passive Design Strategies for Thermal Comfort Analysis
The results of the study indicated that the thermal environment of the office room for
the period of study was not favorable to the occupants, and lied in the zone of a cooler
environment, with the PMV values being within −1.22 and 1.11. This is in conformity
with the case that experiments were performed on an unconditioned building in
the winter season. The results also concluded that the percentage of occupants not
comfortable with their thermal environment was high (36.61%), suggesting that
measures should be taken to bring down this value and make the indoor zone within
S. F. Ali and D. Rakshit
Fig. 4.4 Simulation
software results
0
3
6
9
12
15
18
21
24
27
30
33
36
39
42
-1.4 -1.2 -1 -0.8 -0.6 -0.4 -0.2 0 0.2 0.4 0.6 0.8 1 1.2 1.4
PPD (%)
PMV
4.3.2 Analysis Led Design Results and Validation
The PMV and PPD values estimated with the help of the software were then tabulated
and plotted in the form of a graph, as shown in Fig. 4.4. Simulation results yielded the
minimum PMV value as −1.22 and the maximum PMV value as 1.11. These results
too indicate thermally cooler conditions prevailing in the office room for most of the
cases. The corresponding maximum PPD value reached is 36.61% in this case, which
also indicates the percentage of people not feeling comfortable with their thermal
environment.
On comparing the experimental results with that obtained from simulation, it was
found that the two curves were approximately identical with each other and with
the ideal PMV versus PPD curve. However, a little deviation in the outcomes was
found, with the maximum deviation between the experimental and simulation results
being 2.78%, which falls within the range of permissible errors, i.e., 15%. It implies
the validation of the simulation results with the experimental ones. Hence, it was
suggested that the simulation software could be used to proceed further with the
study.
4.3.3 Passive Design Strategies for Thermal Comfort Analysis
The results of the study indicated that the thermal environment of the office room for
the period of study was not favorable to the occupants, and lied in the zone of a cooler
environment, with the PMV values being within −1.22 and 1.11. This is in conformity
with the case that experiments were performed on an unconditioned building in
the winter season. The results also concluded that the percentage of occupants not
comfortable with their thermal environment was high (36.61%), suggesting that
measures should be taken to bring down this value and make the indoor zone within