

13 Review on PCM Application for Cooling Load Reduction …
267
1
U e f
=
1
h o
+
δ 1
k 1
+
δ 2
k 2
+
δ 3
k 3
(13.7)
where, δ 1 , δ 2 , δ 3 , k 1 , k 2 , k 3 are thickness and the thermal conductivity (W/mK) of
PCM, tray material and brick respectively. k 2 is assumed to be very high hence term
δ 2
k 2
≈ 0 (assumed).
13.10 Results and Discussion
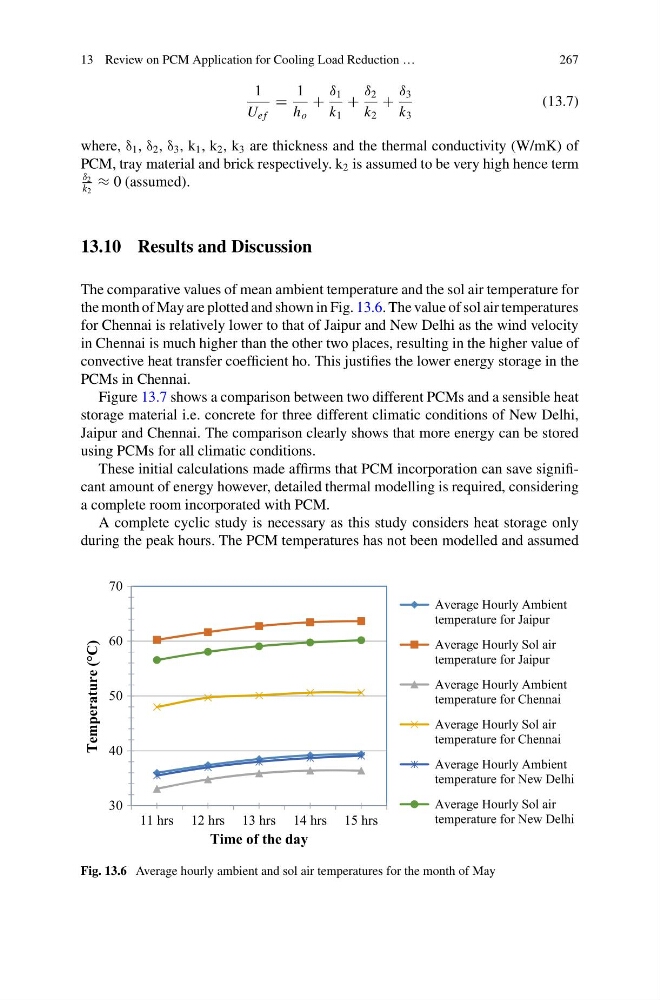
The comparative values of mean ambient temperature and the sol air temperature for
the month of May are plotted and shown in Fig. 13.6. The value of sol air temperatures
for Chennai is relatively lower to that of Jaipur and New Delhi as the wind velocity
in Chennai is much higher than the other two places, resulting in the higher value of
convective heat transfer coefficient ho. This justifies the lower energy storage in the
PCMs in Chennai.
Figure 13.7 shows a comparison between two different PCMs and a sensible heat
storage material i.e. concrete for three different climatic conditions of New Delhi,
Jaipur and Chennai. The comparison clearly shows that more energy can be stored
using PCMs for all climatic conditions.
These initial calculations made affirms that PCM incorporation can save significant amount of energy however, detailed thermal modelling is required, considering
a complete room incorporated with PCM.
A complete cyclic study is necessary as this study considers heat storage only
during the peak hours. The PCM temperatures has not been modelled and assumed
30
40
50
60
70
11 hrs 12 hrs 13 hrs 14 hrs 15 hrs
Average Hourly Ambient
temperature for Jaipur
Average Hourly Sol air
temperature for Jaipur
Average Hourly Ambient
temperature for Chennai
Average Hourly Sol air
temperature for Chennai
Average Hourly Ambient
temperature for New Delhi
Average Hourly Sol air
temperature for New Delhi
Time of the day
Temperature (°C)
Fig. 13.6 Average hourly ambient and sol air temperatures for the month of May
267
1
U e f
=
1
h o
+
δ 1
k 1
+
δ 2
k 2
+
δ 3
k 3
(13.7)
where, δ 1 , δ 2 , δ 3 , k 1 , k 2 , k 3 are thickness and the thermal conductivity (W/mK) of
PCM, tray material and brick respectively. k 2 is assumed to be very high hence term
δ 2
k 2
≈ 0 (assumed).
13.10 Results and Discussion
The comparative values of mean ambient temperature and the sol air temperature for
the month of May are plotted and shown in Fig. 13.6. The value of sol air temperatures
for Chennai is relatively lower to that of Jaipur and New Delhi as the wind velocity
in Chennai is much higher than the other two places, resulting in the higher value of
convective heat transfer coefficient ho. This justifies the lower energy storage in the
PCMs in Chennai.
Figure 13.7 shows a comparison between two different PCMs and a sensible heat
storage material i.e. concrete for three different climatic conditions of New Delhi,
Jaipur and Chennai. The comparison clearly shows that more energy can be stored
using PCMs for all climatic conditions.
These initial calculations made affirms that PCM incorporation can save significant amount of energy however, detailed thermal modelling is required, considering
a complete room incorporated with PCM.
A complete cyclic study is necessary as this study considers heat storage only
during the peak hours. The PCM temperatures has not been modelled and assumed
30
40
50
60
70
11 hrs 12 hrs 13 hrs 14 hrs 15 hrs
Average Hourly Ambient
temperature for Jaipur
Average Hourly Sol air
temperature for Jaipur
Average Hourly Ambient
temperature for Chennai
Average Hourly Sol air
temperature for Chennai
Average Hourly Ambient
temperature for New Delhi
Average Hourly Sol air
temperature for New Delhi
Time of the day
Temperature (°C)
Fig. 13.6 Average hourly ambient and sol air temperatures for the month of May