

240
D. Moudgil and V. Khullar
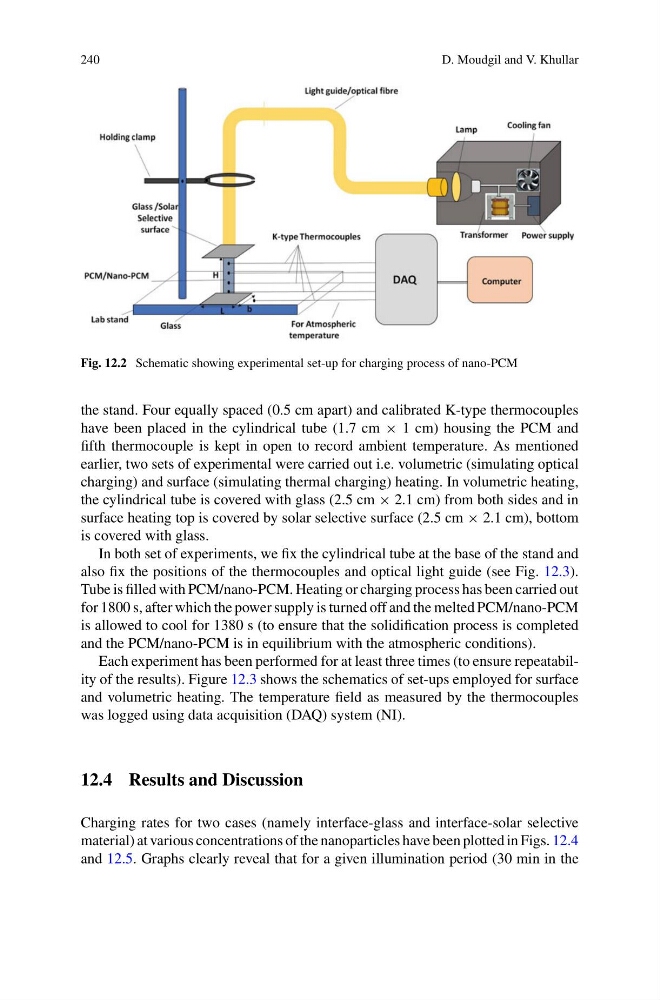
Fig. 12.2 Schematic showing experimental set-up for charging process of nano-PCM
the stand. Four equally spaced (0.5 cm apart) and calibrated K-type thermocouples
have been placed in the cylindrical tube (1.7 cm × 1 cm) housing the PCM and
fifth thermocouple is kept in open to record ambient temperature. As mentioned
earlier, two sets of experimental were carried out i.e. volumetric (simulating optical
charging) and surface (simulating thermal charging) heating. In volumetric heating,
the cylindrical tube is covered with glass (2.5 cm × 2.1 cm) from both sides and in
surface heating top is covered by solar selective surface (2.5 cm × 2.1 cm), bottom
is covered with glass.
In both set of experiments, we fix the cylindrical tube at the base of the stand and
also fix the positions of the thermocouples and optical light guide (see Fig. 12.3).
Tube is filled with PCM/nano-PCM. Heating or charging process has been carried out
for 1800 s, after which the power supply is turned off and the melted PCM/nano-PCM
is allowed to cool for 1380 s (to ensure that the solidification process is completed
and the PCM/nano-PCM is in equilibrium with the atmospheric conditions).
Each experiment has been performed for at least three times (to ensure repeatability of the results). Figure 12.3 shows the schematics of set-ups employed for surface
and volumetric heating. The temperature field as measured by the thermocouples
was logged using data acquisition (DAQ) system (NI).
12.4 Results and Discussion
Charging rates for two cases (namely interface-glass and interface-solar selective
material) at various concentrations of the nanoparticles have been plotted in Figs. 12.4
and 12.5. Graphs clearly reveal that for a given illumination period (30 min in the
D. Moudgil and V. Khullar
Fig. 12.2 Schematic showing experimental set-up for charging process of nano-PCM
the stand. Four equally spaced (0.5 cm apart) and calibrated K-type thermocouples
have been placed in the cylindrical tube (1.7 cm × 1 cm) housing the PCM and
fifth thermocouple is kept in open to record ambient temperature. As mentioned
earlier, two sets of experimental were carried out i.e. volumetric (simulating optical
charging) and surface (simulating thermal charging) heating. In volumetric heating,
the cylindrical tube is covered with glass (2.5 cm × 2.1 cm) from both sides and in
surface heating top is covered by solar selective surface (2.5 cm × 2.1 cm), bottom
is covered with glass.
In both set of experiments, we fix the cylindrical tube at the base of the stand and
also fix the positions of the thermocouples and optical light guide (see Fig. 12.3).
Tube is filled with PCM/nano-PCM. Heating or charging process has been carried out
for 1800 s, after which the power supply is turned off and the melted PCM/nano-PCM
is allowed to cool for 1380 s (to ensure that the solidification process is completed
and the PCM/nano-PCM is in equilibrium with the atmospheric conditions).
Each experiment has been performed for at least three times (to ensure repeatability of the results). Figure 12.3 shows the schematics of set-ups employed for surface
and volumetric heating. The temperature field as measured by the thermocouples
was logged using data acquisition (DAQ) system (NI).
12.4 Results and Discussion
Charging rates for two cases (namely interface-glass and interface-solar selective
material) at various concentrations of the nanoparticles have been plotted in Figs. 12.4
and 12.5. Graphs clearly reveal that for a given illumination period (30 min in the