

224
A. Bhattacharya
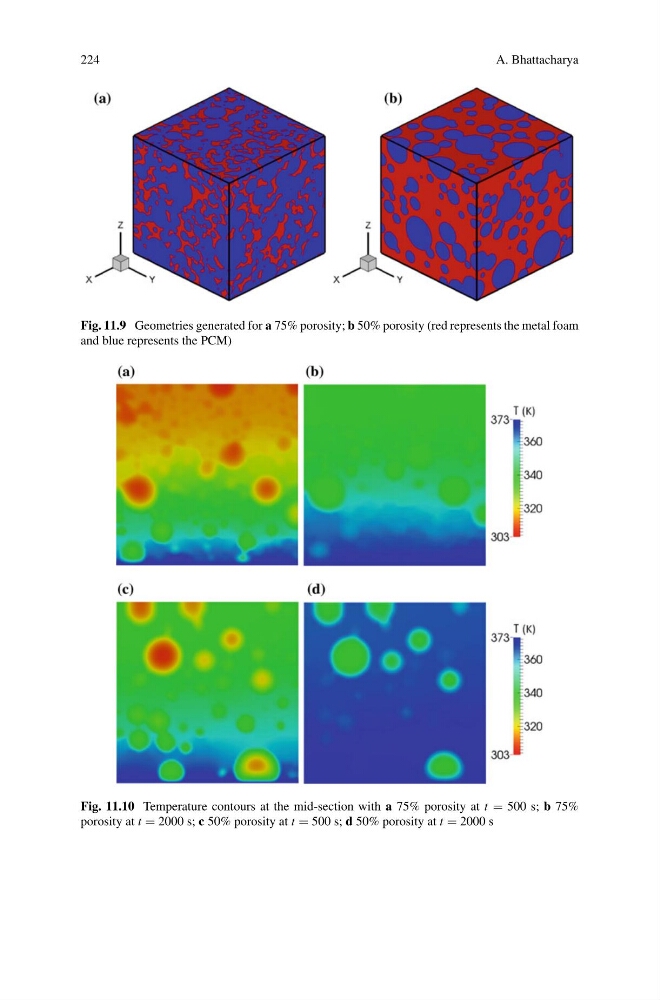
Fig. 11.9 Geometries generated for a 75% porosity; b 50% porosity (red represents the metal foam
and blue represents the PCM)
Fig. 11.10 Temperature contours at the mid-section with a 75% porosity at t = 500 s; b 75%
porosity at t = 2000 s; c 50% porosity at t = 500 s; d 50% porosity at t = 2000 s
A. Bhattacharya
Fig. 11.9 Geometries generated for a 75% porosity; b 50% porosity (red represents the metal foam
and blue represents the PCM)
Fig. 11.10 Temperature contours at the mid-section with a 75% porosity at t = 500 s; b 75%
porosity at t = 2000 s; c 50% porosity at t = 500 s; d 50% porosity at t = 2000 s