

222
A. Bhattacharya
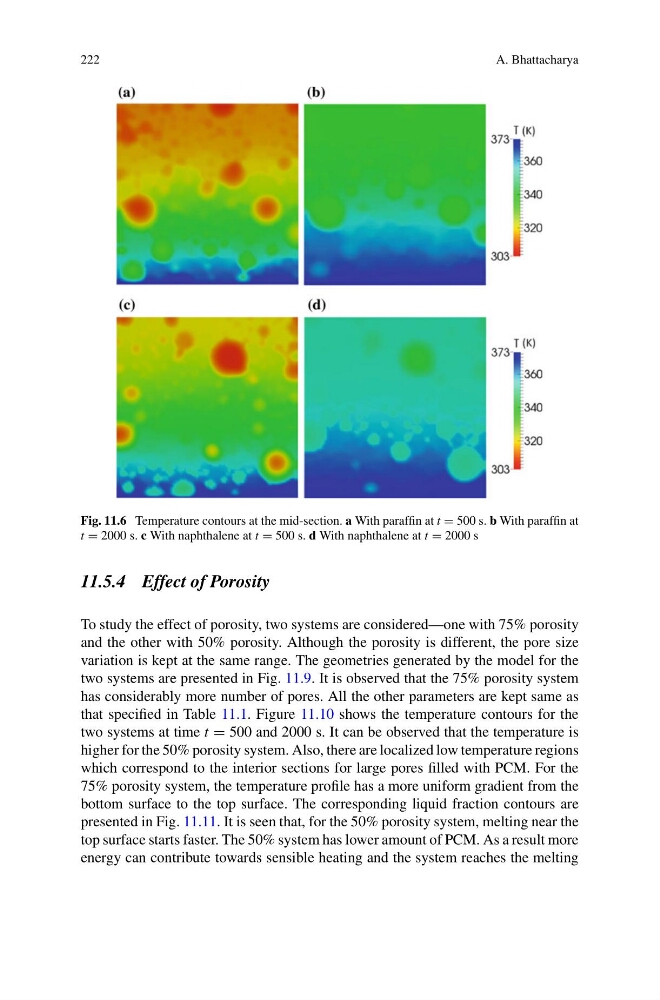
Fig. 11.6 Temperature contours at the mid-section. a With paraffin at t = 500 s. b With paraffin at
t = 2000 s. c With naphthalene at t = 500 s. d With naphthalene at t = 2000 s
11.5.4 Effect of Porosity
To study the effect of porosity, two systems are considered—one with 75% porosity
and the other with 50% porosity. Although the porosity is different, the pore size
variation is kept at the same range. The geometries generated by the model for the
two systems are presented in Fig. 11.9. It is observed that the 75% porosity system
has considerably more number of pores. All the other parameters are kept same as
that specified in Table 11.1. Figure 11.10 shows the temperature contours for the
two systems at time t = 500 and 2000 s. It can be observed that the temperature is
higher for the 50% porosity system. Also, there are localized low temperature regions
which correspond to the interior sections for large pores filled with PCM. For the
75% porosity system, the temperature profile has a more uniform gradient from the
bottom surface to the top surface. The corresponding liquid fraction contours are
presented in Fig. 11.11. It is seen that, for the 50% porosity system, melting near the
top surface starts faster. The 50% system has lower amount of PCM. As a result more
energy can contribute towards sensible heating and the system reaches the melting
A. Bhattacharya
Fig. 11.6 Temperature contours at the mid-section. a With paraffin at t = 500 s. b With paraffin at
t = 2000 s. c With naphthalene at t = 500 s. d With naphthalene at t = 2000 s
11.5.4 Effect of Porosity
To study the effect of porosity, two systems are considered—one with 75% porosity
and the other with 50% porosity. Although the porosity is different, the pore size
variation is kept at the same range. The geometries generated by the model for the
two systems are presented in Fig. 11.9. It is observed that the 75% porosity system
has considerably more number of pores. All the other parameters are kept same as
that specified in Table 11.1. Figure 11.10 shows the temperature contours for the
two systems at time t = 500 and 2000 s. It can be observed that the temperature is
higher for the 50% porosity system. Also, there are localized low temperature regions
which correspond to the interior sections for large pores filled with PCM. For the
75% porosity system, the temperature profile has a more uniform gradient from the
bottom surface to the top surface. The corresponding liquid fraction contours are
presented in Fig. 11.11. It is seen that, for the 50% porosity system, melting near the
top surface starts faster. The 50% system has lower amount of PCM. As a result more
energy can contribute towards sensible heating and the system reaches the melting